
The Pressure to Control Blood Pressure
Rhetoric vs Reality in "Controlling Blood Pressure" Quality Measure

Nothing is more dangerous than drawing false conclusions from data, for in this we plant the seeds of future failures.
My thoughts, rewritten by Claude 3.5 Sonnet.
High blood pressure (BP) is a silent killer, the leading cause of heart attacks and strokes, and costs the US approximately $131 billion/year.1
So, what's wrong with ensuring that doctors are held accountable for controlling BP by creating a quality measure?
The “Controlling Blood Pressure” measure is a great political slogan. However, it is a misinterpretation (or misrepresentation, depending on your point of view) of the real story behind these preventable heart attacks and strokes. Instead of understanding the true complexity of poor outcomes, the medical-industrial complex created a simplistic metric that serves profit over patients.
Let’s dive in.
The video version of this article is embedded below and available on my YouTube Channel.
The audio podcast and video versions are also available on the Podcasts Page.
Anatomy
Quality Measure Description
Percentage of patients 18-85 years of age diagnosed with essential hypertension starting before and continuing into, or starting during the first six months of the measurement period, and whose most recent BP was adequately controlled (<140/90 mmHg) during the measurement period.
Denominator
Patients 18-85 years of age by the end of the measurement period who had a visit during the measurement period and diagnosis of essential hypertension starting before and continuing into, or starting during the first six months of the measurement period.
Numerator
Patients whose most recent BP is adequately controlled (systolic BP < 140 mmHg and diastolic BP < 90 mmHg) during the measurement period.
Denominator Exclusions
On Hospice or palliative care
ESRD, Dialysis, renal transplant
Pregnancy
66-80 with an indication of frailty plus:
Advanced illness diagnosis
Taking dementia medications
81 and older with an indication of frailty
66 and older and living long-term in a nursing home
Reporting Period
Valid patient encounter between Jan 1 and Dec 31.
Data Sources
BP performed by a clinician
Automated BP monitor reading taken by patient and:
Machine capable of remote transmission of BP data
Conveyed to a clinician
If multiple BP is documented, use lower systolic and diastolic numbers
Do not include BP readings taken during an acute inpatient stay or an emergency department (ED) visit.
If no BP is recorded during the measurement period, the patient’s BP is assumed “not controlled.”
Rationale for Quality Measure
Uncontrolled hypertension can lead to several complications, including heart attacks and strokes, and it makes sense to keep BP in control.
This measure was developed to align with guidelines put forward by several medical societies, including USPSTF, ACC/AHA, AAFP, and ADA. All these societies recommend controlling BP to target less than 140/90.
Problems with Quality Measure
Data Doesn’t Lie, But It Doesn’t Tell the Whole Truth
The fact that uncontrolled hypertension leads to excess heart attacks and strokes is indisputable. The “powers to be” want you to believe that doctors are not doing their job of controlling blood pressure, and as with any profession, there are a few bad providers.
However, if you look a little deeper, the root cause of uncontrolled hypertension is much more complex and rooted in social determinants of health (SDOH), which we as a country have decided we are not going to pay for. So, the medical-industrial complex does the next best thing: blame doctors, create a quality measure, and laugh their way to the bank under value-based care.
How do I know this? I looked at the articles cited in the NCQA Quality Measure details on the CMS website. The fundamental error that NCQA made in creating this quality measure is best demonstrated in the picture below.

Furthermore, several other studies have shown a strong link between SDOH and uncontrolled or resistant hypertension, leading to higher mortality.2
As you can see from the picture above, your PCP cannot address the factors leading to uncontrolled hypertension. By creating the “Controlling BP” quality measure, we have indirectly made PCPs responsible for SDOH.
All of this ignores that if you remove all these SDOH barriers, people generally have pretty well-controlled hypertension and related outcomes.
If that is not enough, this quality measure has other unintended consequences.
Patient Selection Bias
The “Controlling Blood Pressure” quality measure penalizes doctors trying to manage populations with poor SDOH, e.g., the homeless, those with low health literacy, or those who distrust the health system, which is the entire reason for creating this quality measure.
For example, if the doctor successfully lowers a systolic BP from 200 to 160 in these populations, they dramatically lower the cardiovascular risk. However, since the systolic BP of 160 is still considered uncontrolled, these doctors are penalized, which may lead to financial penalties, burnout, or both.
The J Curve Effect
The risks vs benefits of BP control, arguably, follow the “J Curve” effect.3
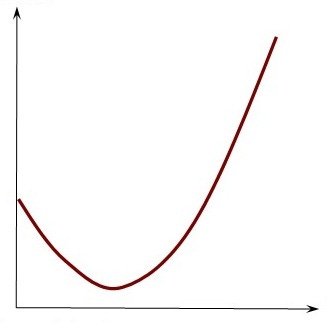
This refers to the phenomenon where lowering BP too much, particularly below a certain critical threshold (or “nadir”), may increase the risk of adverse cardiovascular events by reducing blood supply to critical organs. Paradoxically, this can be worse for people who are sicker with multiple co-morbidities, as aggressive BP lowering may increase the risk of heart attack and falls, leading to hip fractures.
There is an ongoing debate on “what BP is too low” for optimal cardiovascular outcomes, with the joke being “the best BP is just before you pass out.” The SPRINT trial4 reasonably showed that lowering systolic BP to less than 120 reduced all-cause mortality, albeit with an increased risk of medication-related side effects. Since SPRINT excluded people on multiple medications, the incidence of side effects from the aggressive lowering of BP is probably higher in clinical practice.
Now, you may be wondering why I am talking about lowering SBP to 120 when the quality metric target is lower than 140/90. The reason is that this quality measure checks all the boxes of why quality measures don’t work, which I discussed in my prior article, “The Quality of Quality Measurement,” including:
Changing a medical decision from complex to simple domain in the Cynefin Framework
Goodheart’s law
Charles Perrow’s theory of normal accidents that combine complexity with a time-bound target
In practice, this creates several challenges:
Aggressive prescribing for people whose BP is controlled at home but high in clinical settings leading to harm (e.g., hypotension, falls, and fractures)
Not being aggressive enough with high-risk people who may benefit from a BP target in line with the SPRINT trial (i.e., systolic BP of 120) because the target was met.
People who don’t take their BP medications (or cannot afford them) may be discharged as non-compliant, which improves the quality score.
Even the JNC Guidelines have flip-flopped between target systolic BP of 140 and 150 for older adults. Forcing a “one size fits all” approach has the potential to cause more harm by pushing people towards the slopes in the J-curve.
SMART Criteria
SMART criteria are often used to ensure the objective is clearly defined and attainable. Let’s apply the SMART criteria to the BP quality measure.
Specific:
The measure is specific in defining BP control as <140/90 mmHg for adults aged 18–85 with hypertension.
Measurable:
The quality metric is technically measurable, but there are several nuances:
In which setting should the BP be taken? E.g., Home, doctor’s office
Who should take the BP to ensure accuracy? e.g., patients themselves or medical office staff
Which BP reading should we use:
Average of all BP readings taken throughout the year?
BP taken during an annual physical? What if an Annual Physical was not done?
BP taken only on office visits in which the ICD-10 code of hypertension was billed?
The last reading of the year?
Achievable:
Achieving BP control of 140/90 may be more difficult or not possible without inflicting harm in some populations, e.g., people with white coat hypertension, wide pulse pressure, or orthostatic hypotension.
Relevant:
While there is plenty of data to show that lower BP decreases the risk of cardiovascular morbidity and mortality, due to the “J-curve effect,” the BP targets may not be generalizable to the entire population.
Time-bound:
The measure is time-bound, as it evaluates BP control within the measurement year. However, the reliance on a single reading rather than ongoing control over time limits its ability to assess sustained improvements in patient health.
The Qualifying Encounter Rule
One of the central challenges in BP management is the infamous “qualifying encounter” rule. For a BP reading to count toward the numerator, it must be controlled during the last outpatient "billable" office visit of the year. If BP isn't checked during this visit, the PCP/ACO is automatically deemed non-compliant.
The implications of this rule are completely bonkers.
Perhaps most absurd is that your humble PCP is held responsible when BP is not taken during specialist office visits.
The last quarter coincides with New England winter, bringing waves of respiratory infections and injuries due to people falling on ice. PCPs struggle to accommodate sick visits while potentially short-staffed. As most clinicians know, BP measurements during acute illness are notoriously unreliable.
If that was not enough, consider these scenarios where PCPs/ACOs fail the quality measure despite excellent BP control throughout the year:
PCP visit on December 31 for COVID-19, where staff appropriately omitted BP measurement due to infection control protocols.
Telephone/Video encounters for sick visits where the patient did not check and report BP to office staff or doctor to document in EHR.
Orthopedics office visit for a severe ankle sprain while taking NSAIDs (which can elevate BP).
Dermatology office visit for a rash, where BP isn't routinely checked.
Telehealth follow-up with a psychiatrist for prescription management.
Perhaps most absurd is that your humble PCP is held responsible when BP is not taken during specialist office visits. Even when we identify patients with missing or elevated readings from specialist encounters, addressing this requires scheduling another billable visit because patient-reported home BP logs cannot be used for compliance—forcing patients to pay additional copays or full visit costs under high-deductible plans.
The Risks of Aggressive BP Management
Despite randomized controlled trials showing mortality benefits from tight BP control, implementing such targets as quality measures raises concerns about overtreatment. Inaccurate BP measurements, white coat hypertension, wide pulse pressure, or other issues in everyday practice can lead to excessive medication use, resulting in hypotension and other adverse effects. While evidence of harm remains largely anecdotal, it highlights the need to test these quality measures in real-world clinical trials before widespread implementation.
Paradoxically, busier or poorly trained providers are more likely to over-medicate than higher-performing practices. Therefore, this quality measure can potentially harm patients and promote mediocrity over excellence.
Improving Performance on “Controlling High BP”
Now that we understand the challenges with this quality measure, let us look at some strategies to improve performance. These strategies assume the patient’s BP is controlled at home.
The strategy to improve performance can be divided into two categories:
Collecting/documentation of BP data
Submitting data
BP documentation during an office visit
Office staff needs to be trained to measure BP properly. While PCPs and some specialist offices (e.g., cardiology, nephrology) that manage hypertension generally train their staff well, this can be an issue in other specialist offices.
Create a protocol for staff to repeat BP if the first reading is high. In many offices, doctors run behind, and the patient is waiting in the exam room. Use this to your advantage. The second BP reading is generally lower, as people are less anxious and feel like staff/doctors did not forget about them.
People with white-coat hypertension or those with normal BP readings at home should check their BP at home on the morning of their office visit. Use this value instead of the spurious higher office BP reading when documenting BP in the vitals sections of the EHR (this is a grey area and not clearly spelled out in the quality measure; it is open to interpretation).
If a person has orthostatic hypotension, use sitting or standing BP values, which will be lower.
BP documentation during Telehealth Visits
Establish a staff protocol requiring all patients with hypertension to check their BP before starting their telehealth visits, even for sick visits unrelated to hypertension management. While some patients may resist this protocol, many will still comply, improving performance.
Collecting Data in Q4
Since only the last BP during an office visit counts for the numerator, PCPs/ACOs need a workflow to ensure that the last BP of the year is normal.
Maintain an accurate list of all attributed patients
Collect BP data from all qualifying encounters
The Electronic Data Warehouse (EDW) must be structured to pull discrete BP data from all qualifying encounters from EHR or Health Information Exchange (HIE) encounters.
Identify all attributed patients with BP > 140/90
ACO care coordinators or PCP office staff contact these patients to schedule appointments, preferably in December, and document BP.
Pray that attributed patients don’t have another qualifying encounter with another specialist, and if they do, a BP is done and is normal.
If the patient has another encounter in which either BP is not taken or is elevated, the EDW should send a real-time alert to the care coordinator or PCP office to contact and schedule another “billable visit.”
EHRs can use AI to extract BP values from faxed notes sent to PCPs’ EHRs. AI can then use this data to generate a report for office staff to contact these attributed patients.
Submitting QRDA III
To qualify for the eCQM, ACO EDW (Population Health IT Platform) must create QRDA III files and submit data to insurance companies and CMS.
Submitting CPT-II Codes
CPT-II codes will no longer be accepted under the eCQM logic. However, depending on contract negotiations, some private insurance companies may still accept them.
Submitting Data Using Spreadsheets
If a health plan cannot accept QRDA III files, then BP data is generally submitted in Excel or CSV files in the format specified by the payor.
Conclusion
In summary, the NCQA’s requirement for BP < 140/90 during the year’s final encounter illustrates Goodhart's Law perfectly: “When a measure becomes a target, it ceases to be a good measure.”
This approach has forced PCPs and ACOs to develop workarounds:
Scheduling extra visits for spuriously high BP readings or if BP was not taken
Selective documentation of normal BP
Workflows designed for metrics, not patient care
Managing hypertension is important. The “Controlling BP” quality measure increases administrative burden, raising costs for both PCPs and patients while increasing the risk of harm.
So what will we achieve in the end—my bet is better “BP numbers” due to Goodheart’s law, with minimal decrease in cardiovascular events and costs.
Up Next
In the next article, we will examine a quality measure that has led entire pharmacy chains to reengineer their workflows to improve performance, often at the expense of PCPs and patients.
Kirkland, E. B., Heincelman, M., Bishu, K. G., Schumann, S. O., Schreiner, A., Axon, R. N., Mauldin, P. D., & Moran, W. P. (2018). Trends in Healthcare Expenditures Among US Adults With Hypertension: National Estimates, 2003-2014. Journal of the American Heart Association, 7(11), e008731. https://doi.org/10.1161/JAHA.118.008731
Akinyelure, O. P., Jaeger, B. C., Oparil, S., Carson, A. P., Safford, M. M., Howard, G., Muntner, P., & Hardy, S. T. (2023). Social Determinants of Health and Uncontrolled Blood Pressure in a National Cohort of Black and White US Adults: The REGARDS Study. Hypertension, 80(7), 1403–1413. https://doi.org/10.1161/HYPERTENSIONAHA.122.20219
Angeli, F., Reboldi, G., & Verdecchia, P. (2013). Hypertension and the J-curve phenomenon: Implications for tight blood pressure control. Hypertension Research, 36(2), 109–111. https://doi.org/10.1038/hr.2012.165
‘J-Curve’ in Hypertension May Be Explained by Differences in Patient Characteristics. (2017, September 26). TCTMD.Com. https://www.tctmd.com/news/j-curve-hypertension-may-be-explained-differences-patient-characteristics
Kallistratos, M. S., & Manolis, A. J. (n.d.). Hypertension Control: J-Curve Revisited.
SPRINT Research Group, Wright, J. T., Jr, Williamson, J. D., Whelton, P. K., Snyder, J. K., Sink, K. M., Rocco, M. V., Reboussin, D. M., Rahman, M., Oparil, S., Lewis, C. E., Kimmel, P. L., Johnson, K. C., Goff, D. C., Jr, Fine, L. J., Cutler, J. A., Cushman, W. C., Cheung, A. K., & Ambrosius, W. T. (2015). A Randomized Trial of Intensive versus Standard Blood-Pressure Control. The New England journal of medicine, 373(22), 2103–2116. https://doi.org/10.1056/NEJMoa1511939