
VBC Financial Simulation Model
Simulate How & Why Contracts Matter More than Care

Value-Based Care (VBC), at a conceptual level, is simple to understand and makes sense: better outcomes at a lower total cost of care.
How can someone argue against that?
But scratch the surface, and suddenly things get complicated—really complicated.
I wrote a series of 5 articles trying to explain the complexity inherent in VBC. This complexity inherently favors consolidation, which then increases the total cost of care. These articles are:
From Doctors to Social Workers - How “Population Health” laid the foundation for Value Based Care
Value Based Care and the Illusion of Improvement - Turning Healthcare into a High-Stakes Game of Metrics and Madness
Who’s your PCP? Patient Attribution in VBC: Where Accountability Meets Confusion
How Much Is Your Diagnosis Worth? Risk Factor Inflation and Paradox of Shared Savings
Blundering Bundles - Why Bundled Payments Might Be Tying Providers & Patients Up in Knots
Essentially, what I was trying to convey was that the definition of VBC has been distorted to:
Furthermore, as I talk to more and more people, I have come to realize two things:
VBC is equated with CMS Medicare MSSP/ACO, not with Medicare Advantage (MA) VBC contracts
Using the word “care” in “value-based care” is deeply misleading and problematic.
VBC is NOT a care model; it is a business contract between two parties.
The term “care” should be replaced with “contract,” i.e., VBC should be called “value-based contract,” as the terms of the contract in VBC are far more influential in achieving shared savings than provider performance.
In order to illustrate how these contracts influence shared savings far more than physician performance, I vibe-coded a VBC financial simulation model that mimics a value-based contract for a fictional ACO.
The video version of this article is embedded below and available on my YouTube Channel.
The audio podcast and video versions are also available on the Podcasts Page.
The video is a screencast showing how the model works and what the outputs mean.
Regional Financial Simulation Model
The regional financial simulation model starts with the familiar story that the cost of care is out of control. The payors approach a large PCP practice to form an ACO to participate in VBC to control the total cost of care for patients that they manage. If the ACO is successful, the payors will share any savings with the ACO.
The large PCP practice performs back-of-the-envelope calculations and determines that an ACO is financially lucrative. They recruit other independent practices to join the ACO and sign VBC contracts with the payors.
This is the setup.
If you are familiar with VBC dynamics and want to dive in and play with the model, click on the button below:
For those who may not be familiar with VBC, I strongly encourage you to watch the video. I have provided a written walkthrough of the model below, which you can also use as a reference when experimenting with the model.
Baseline Assumptions
The simulation model assumes a contract negotiation between a fictitious regional ACO and Medicare Advantage (MA) plans.
CMS MSSP/ACO contracts are generally designed to avoid mass exodus and failure of ACOs. While the simulation model can be used for CMS MSSP/ACO contracts, I designed it include MA & commercial contracts because:
As MA plans have grown, PCP panels may have more MA patients than Traditional Medicare
MA and commercial plans don’t have the same long-term incentives as CMS, and contract terms are often tilted to meet payor profit targets.
A PCP practice may be participating in several value-based contracts, including MSSP/ACO, which dramatically increases the complexity and overhead.
Model Steps
With the baseline assumptions out of the way, let’s delve into the model itself. There are 7 steps in the model.
Each step has several variables that the user can adjust. I have made baseline assumptions for each variable, including worst-case, realistic, and best-case scenarios. In addition, many variables include tooltips that explain their meaning.
Step 1: Setup
The first step allows the user to choose the size of the ACO and baseline contract terms.
The size of the ACO is determined by the number of PCPs, their panel, and attribution. Attributed are a subset of the PCP panel that the PCP/ACO is responsible under VBC. Attribution depends on:
Attribution methodology
Payor mix, i.e., of all the insurances that the PCP office accepts, what percentage of these patients have an insurance plan that participates in VBC
You can learn more about attribution in my previous article, “Who’s Your PCP?”
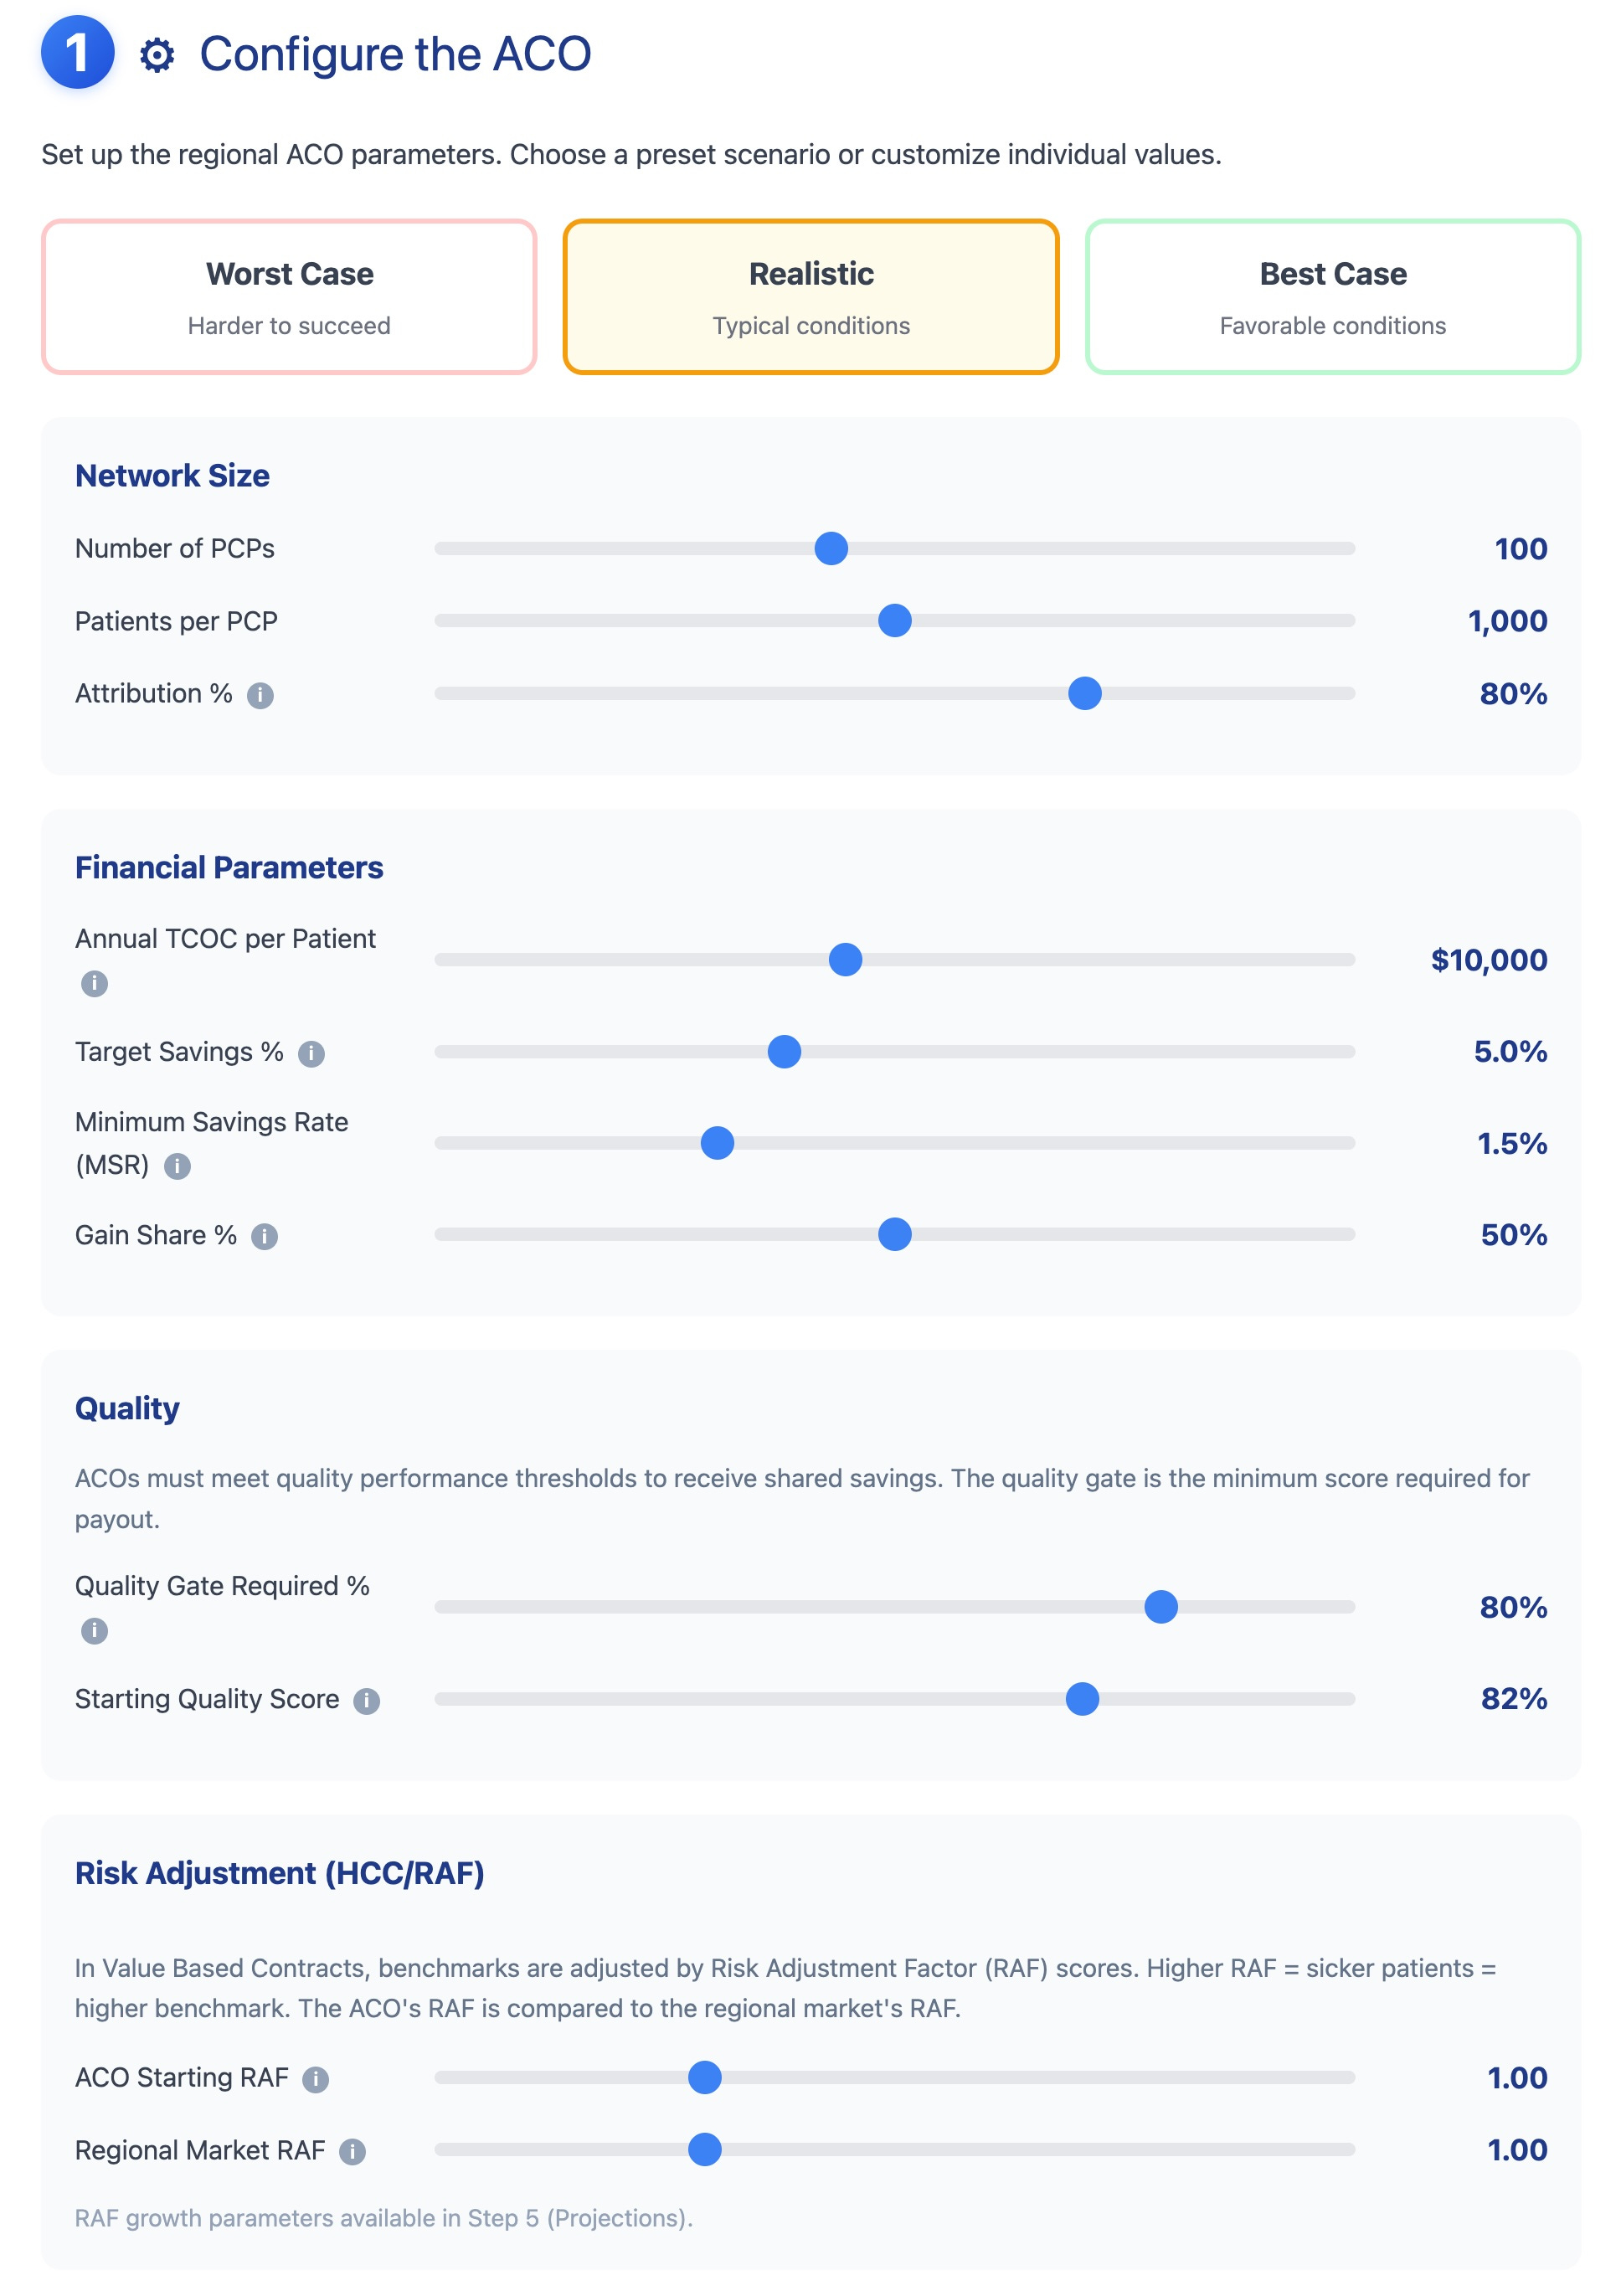
On the financial side, ACO performance is largely determined by four numbers in the contract:
Target Savings %
This is the percentage reduction in Total Cost of Care (TCOC) that the ACO must achieve to receive a maximum payout (also known as a gain share). A 5% target on $1 billion TCOC means the ACO needs to reduce spending by $50 million.
Minimum Savings Rate (MSR)
This is a binary, met/not-met gate. If the ACO achieves savings below the MSR threshold, the ACO receives zero payout—even if it saved money.
E.g., if the MSR is set to 2%, and the ACO that reduces TCOC by 1.9%, it gets nothing.
The MSR was designed to protect payers from paying out shared savings that might be statistical noise rather than genuine improvement. But this is a point of negotiation!
ACO Share / Payer Share Split
If the ACO hits the target, who keeps the savings? In a 50/50 split, the ACO receives 50% of the realized savings, and the payer keeps the other 50%.
This split is negotiated, not earned.
Quality Gate
In the model, quality is implemented as a binary gate. The ACO must meet a minimum quality score (based on various quality measures) to receive any payout, i.e. payer keeps 100% of savings.
In real life, the quality gate is a mix of binary gates and a sliding scale. Once an ACO crosses the quality gate threshold, it can earn more for meeting higher quality thresholds.
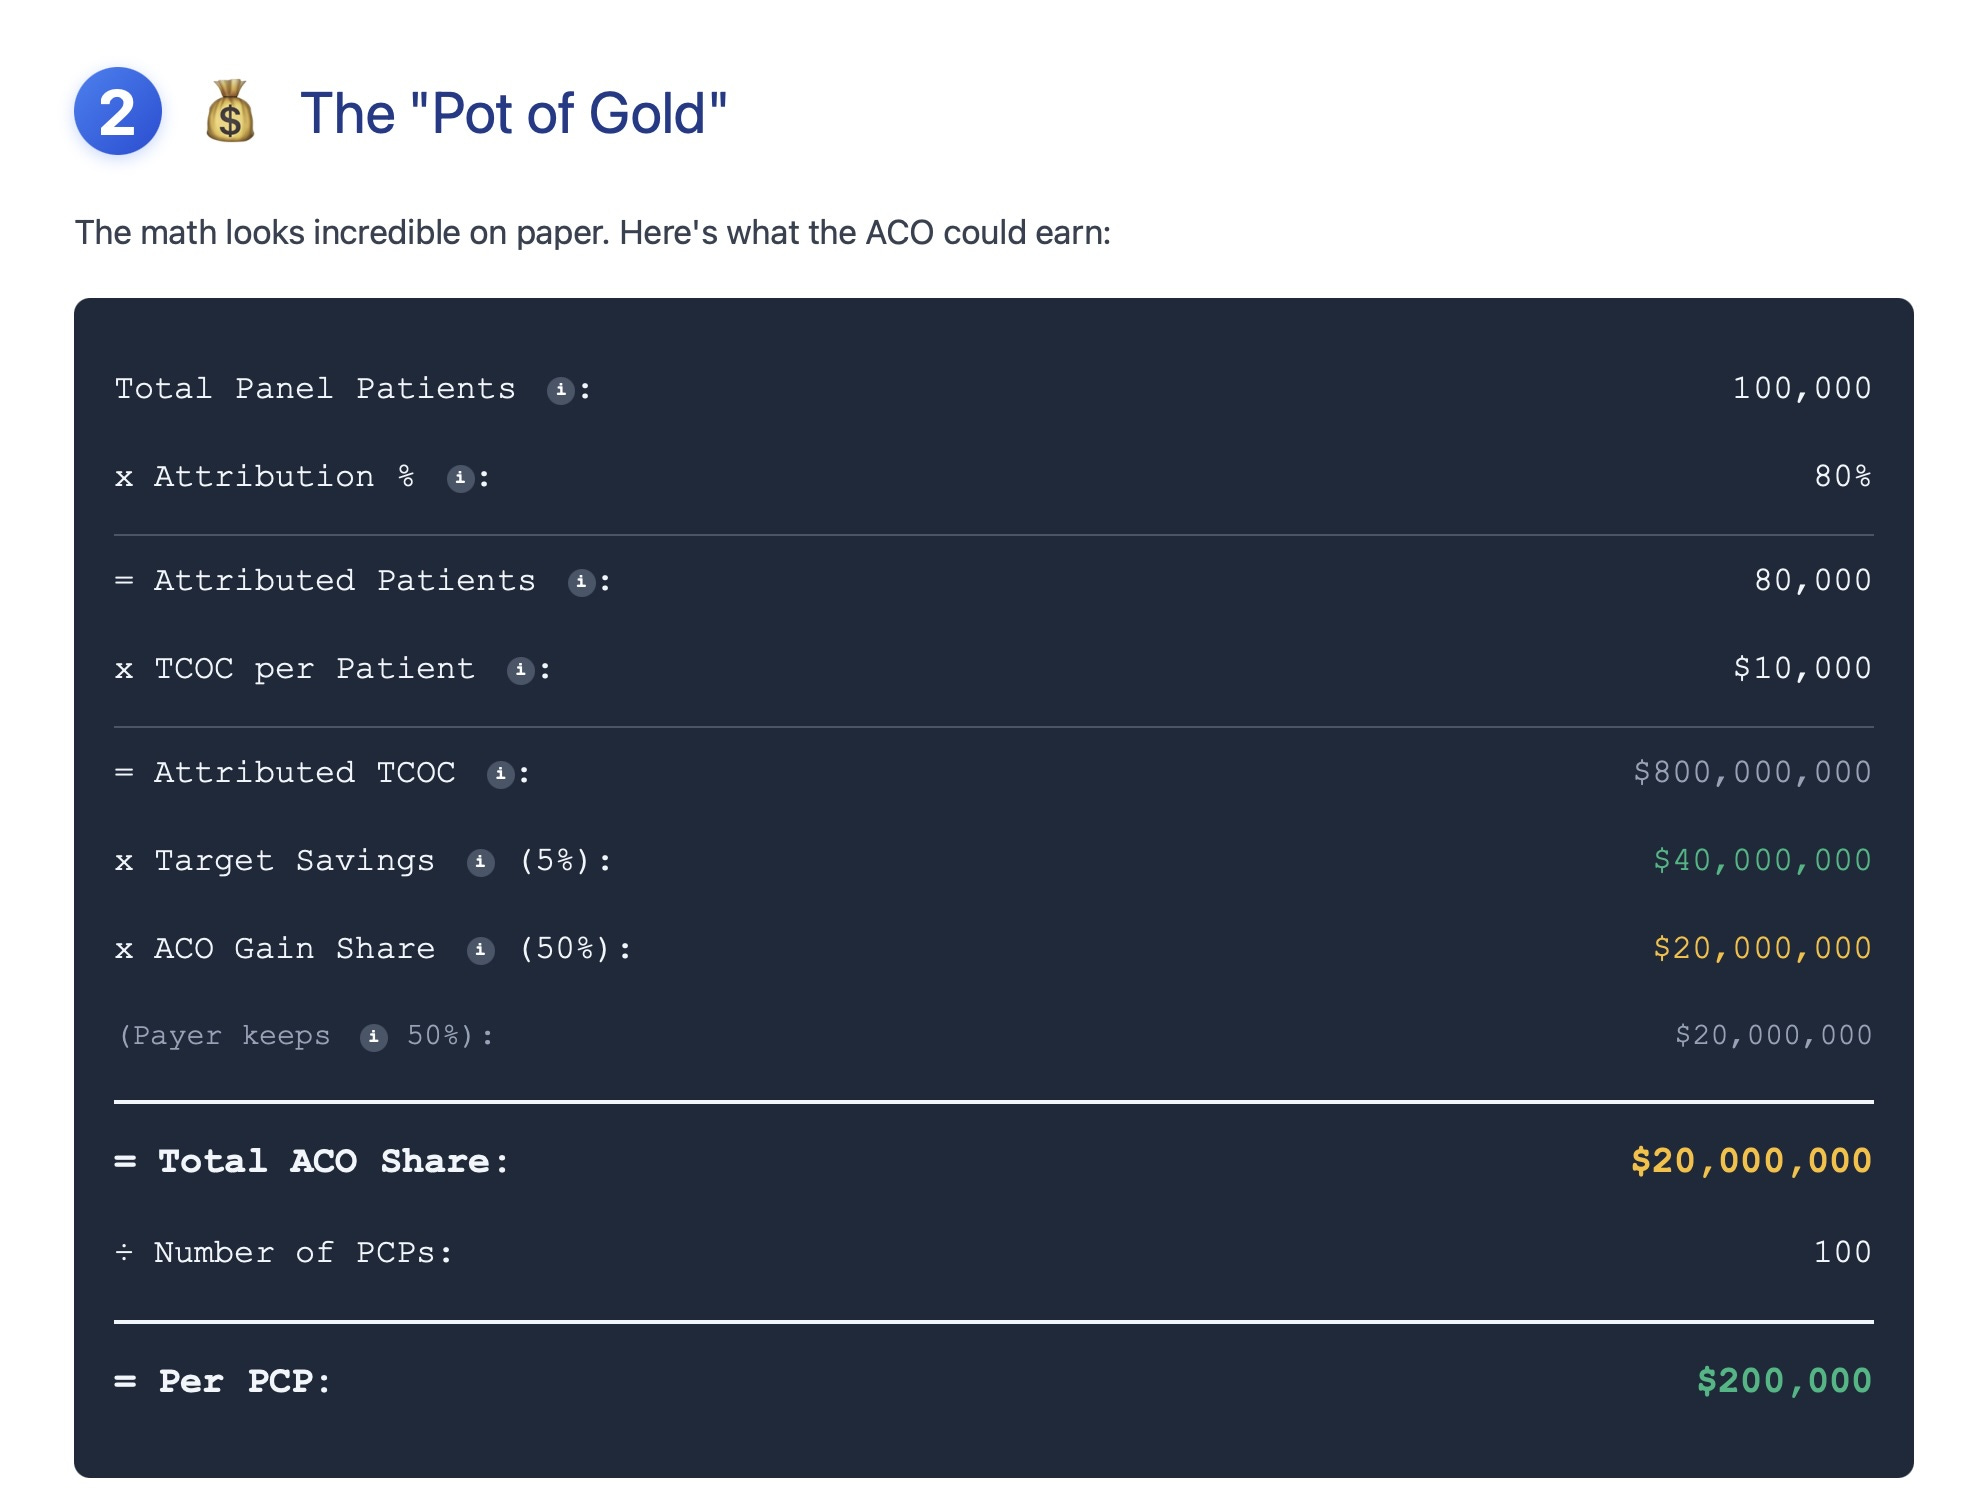
Step 2: Opportunity
This step is the back-of-the-envelope calculation on ACO savings opportunities based on the assumptions in Step 1.
Step 3: Reality Sets In
This step simulates the costs required to establish an ACO. These are fixed costs that are incurred regardless of whether the ACO achieves shared savings. If the ACO cannot meet its fixed costs obligations, it will fail.
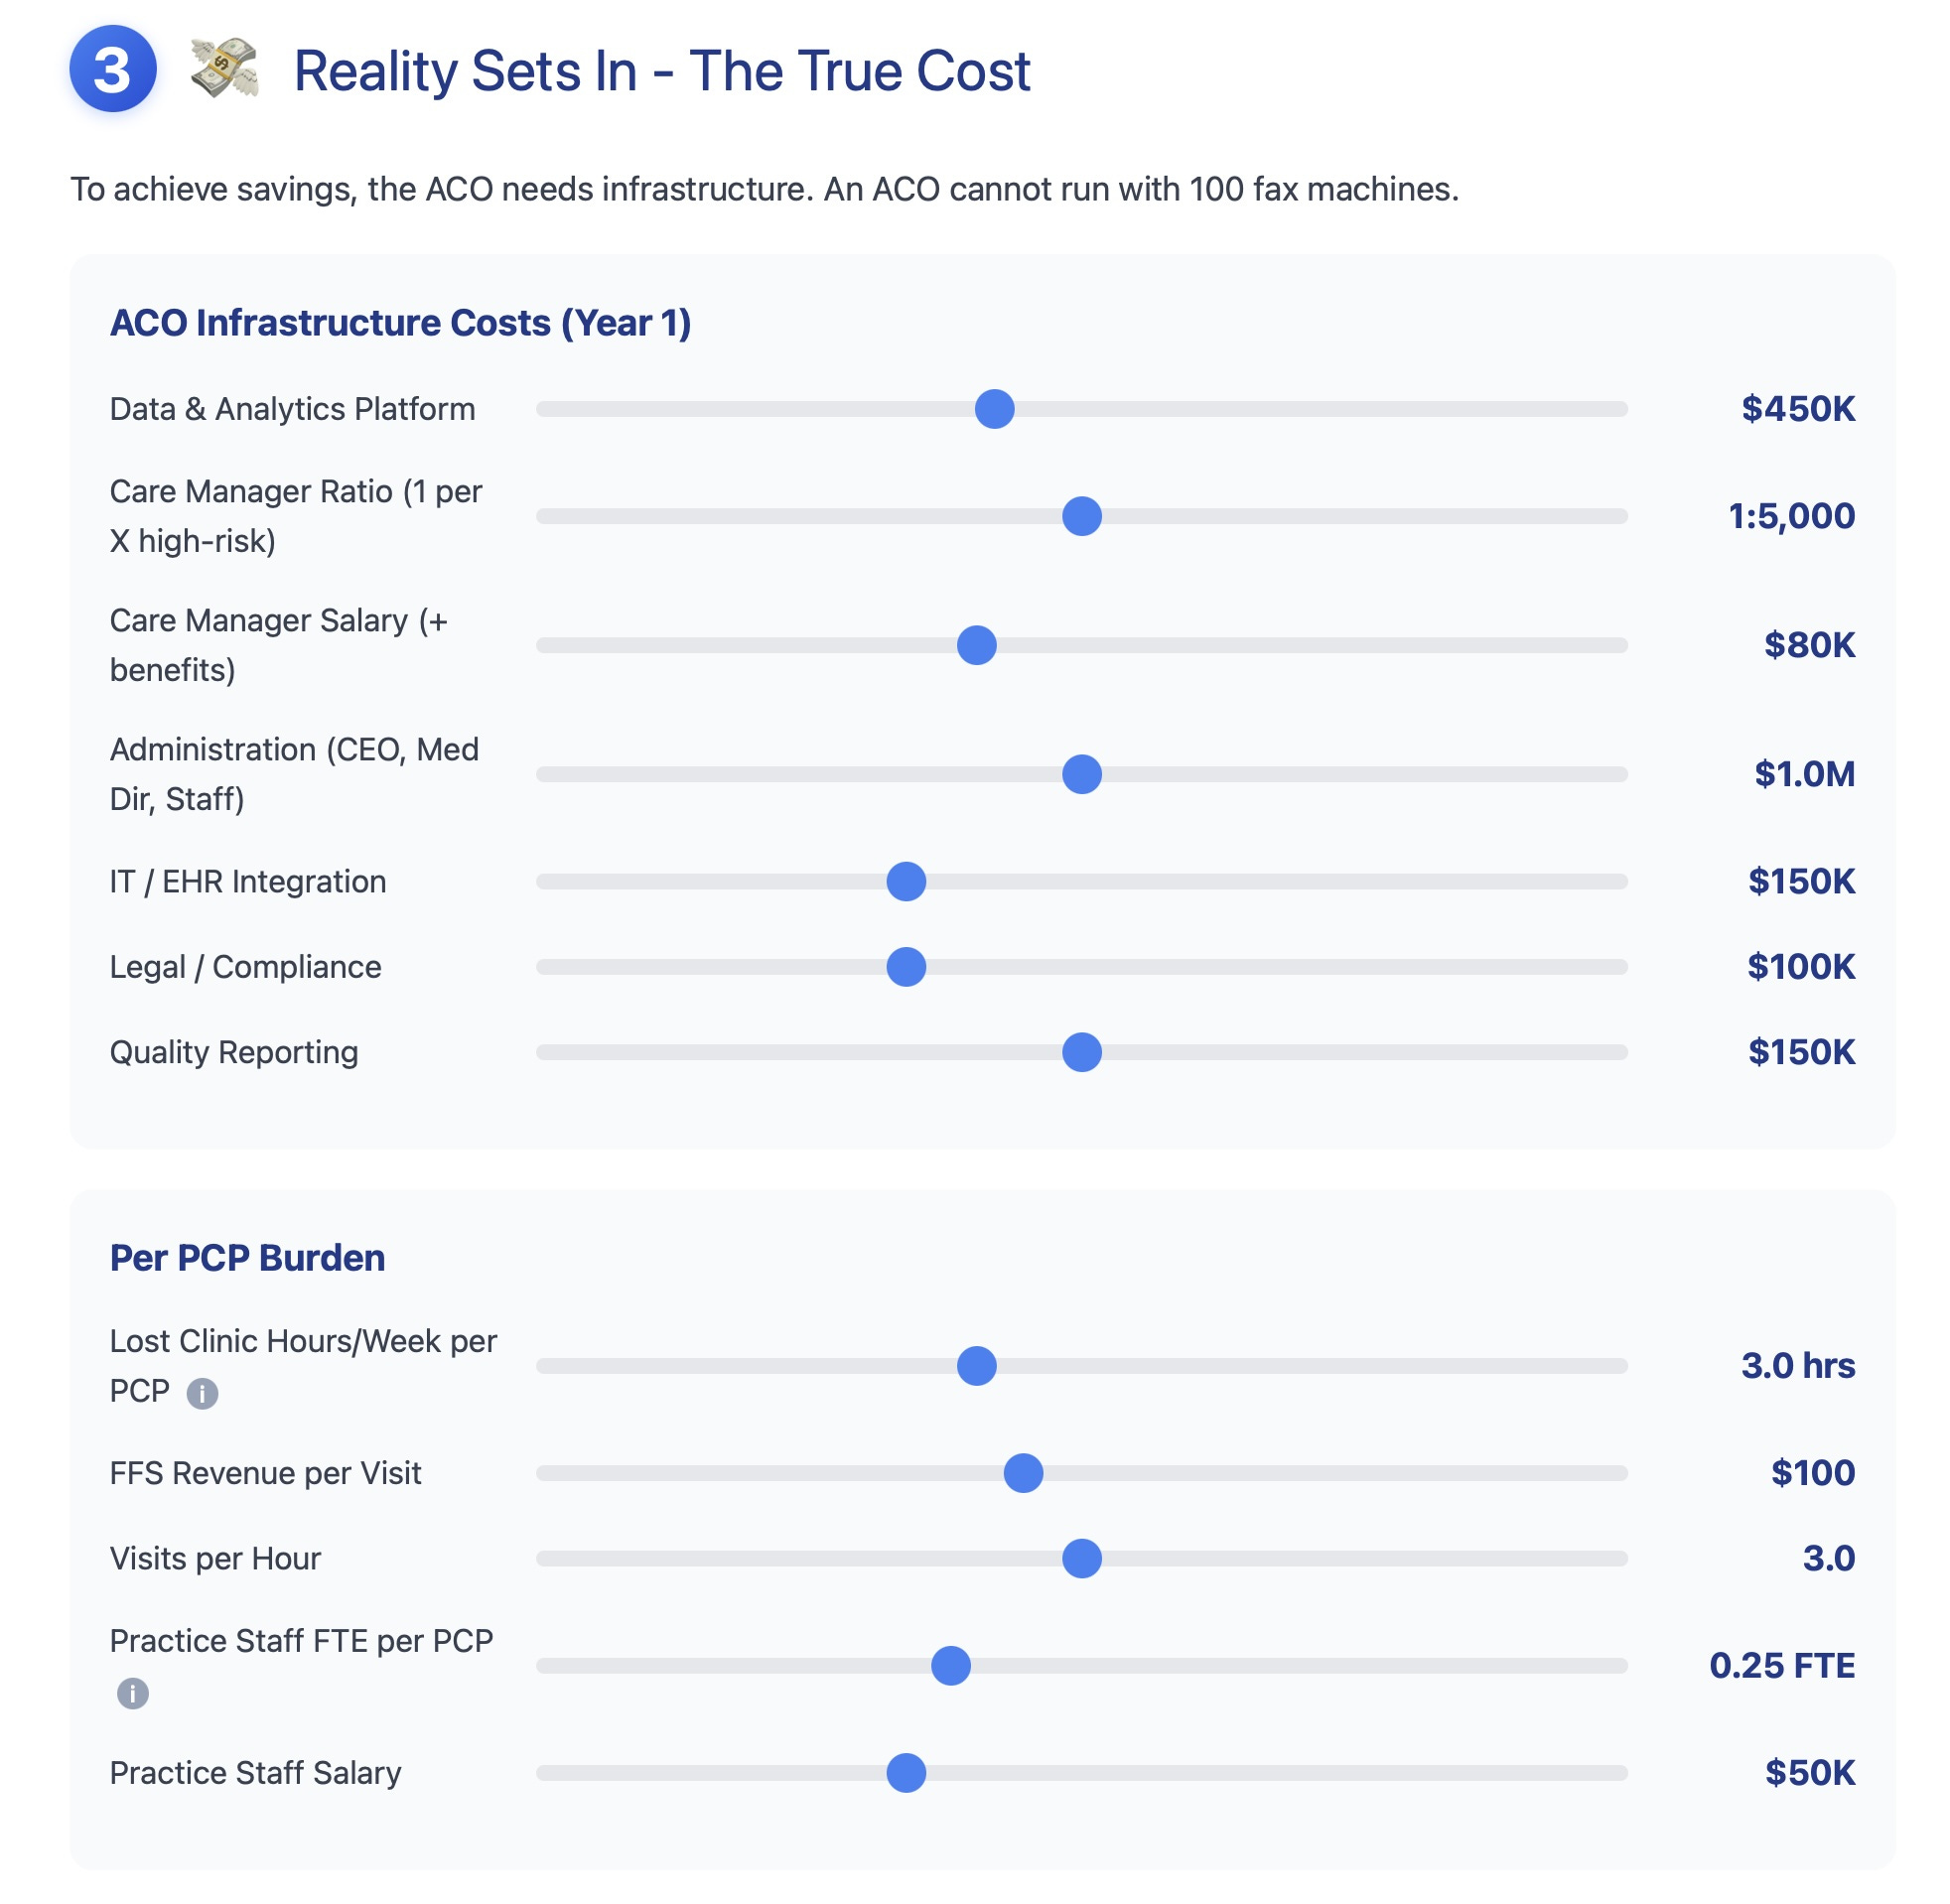
In addition to ACO fixed costs, each PCP incurs additional costs due to increased workload to meet VBC requirements. These workloads include non-billable tasks such as ACO meetings, huddles with care managers, reviews of risk-stratification dashboards, and documentation for quality metrics.
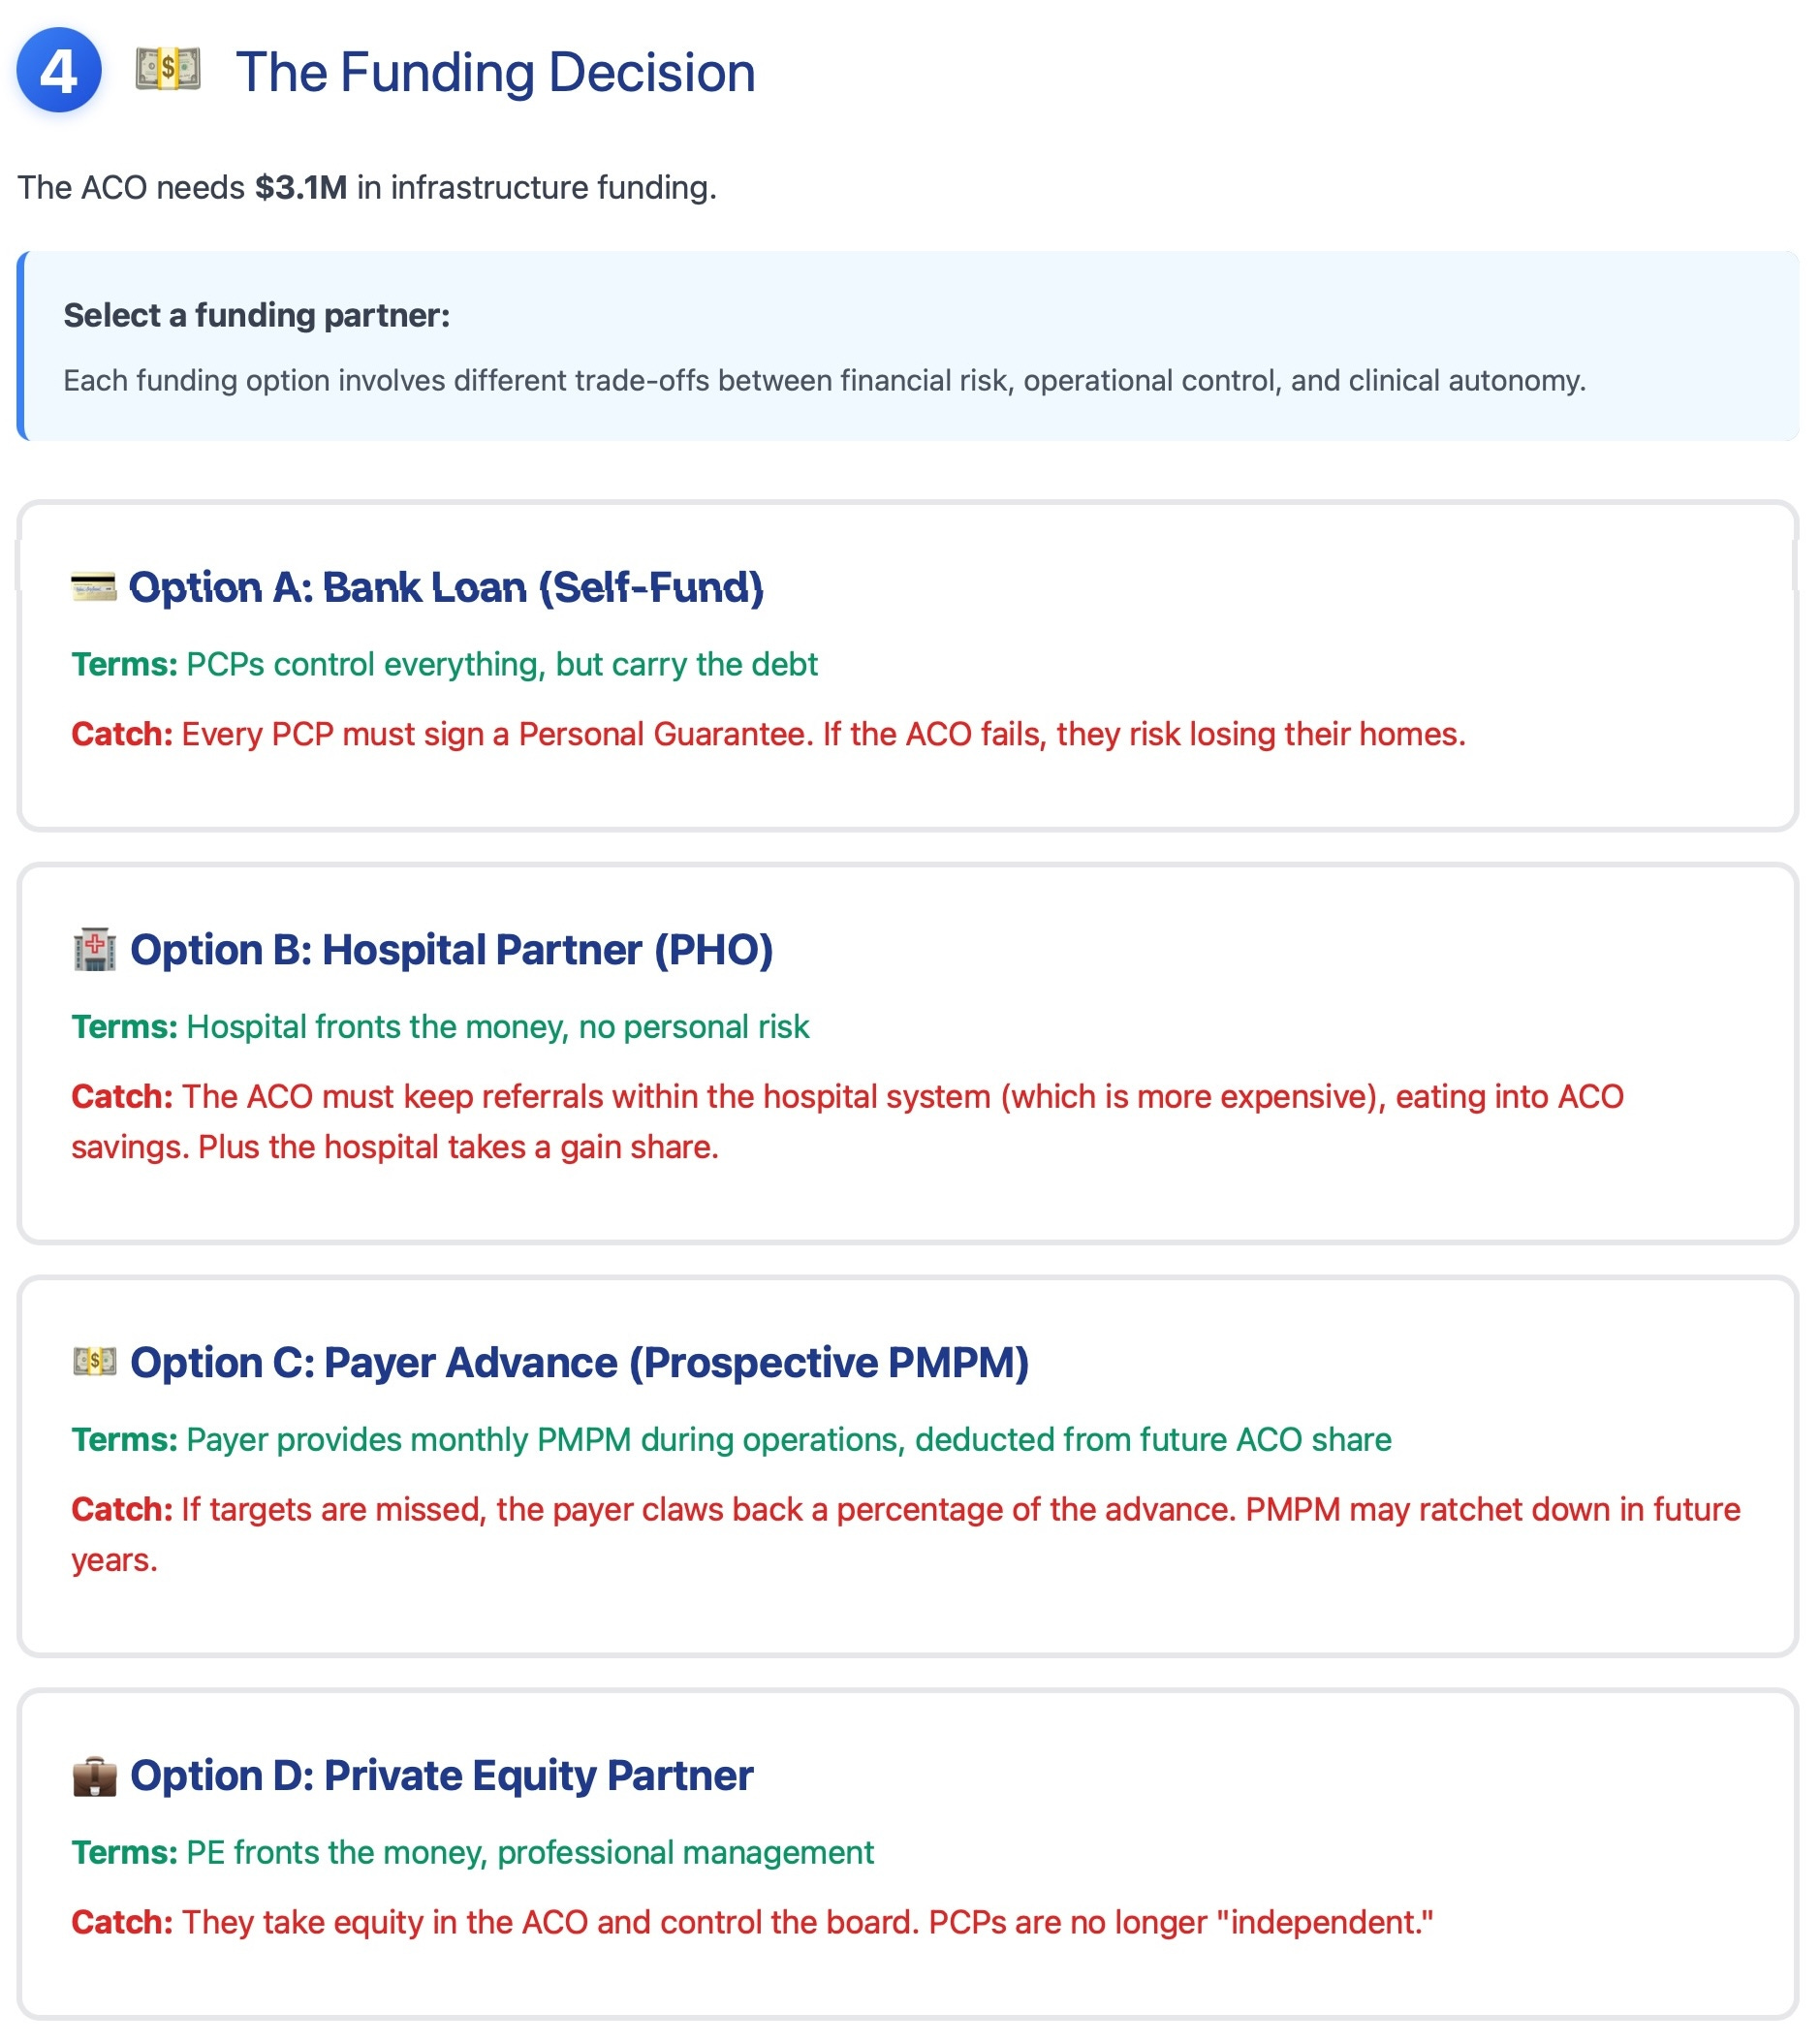
Furthermore, there is a 6-9 month lag between completion of a VBC financial year and reconciliation before payors determine gains or losses. For e.g., if the VBC financial year was 2022 (Jan-Dec), then the reconciliation will be done sometime between July-Sept in 2023, i.e., the 6-9 month lag. This means that the ACO needs funding for at least 18 months to cover fixed costs before it will determine whether it is profitable.
Step 4: The Funding Decision
Since the ACO requires funding to run for at least 18 months, it needs to figure out how to fund itself. Typically, there are four options, each with its own trade-offs.
Bank Loan
Partner with hospital to form a joint venture, i.e., Physician Hospital Organization (PHO)
Payor backed funding in the form of a prospective per member per month (PMPM) payment
Funding from a private equity firm
Step 5: Outcomes
This step shows Year 1 outcomes after reconciliation. The ACO may fall into one of three categories:
Missed Minimum Savings Rate (MSR)
Missed Quality Gate
Saved more money than MSR (or hit the TCOC target) and also met the quality gate
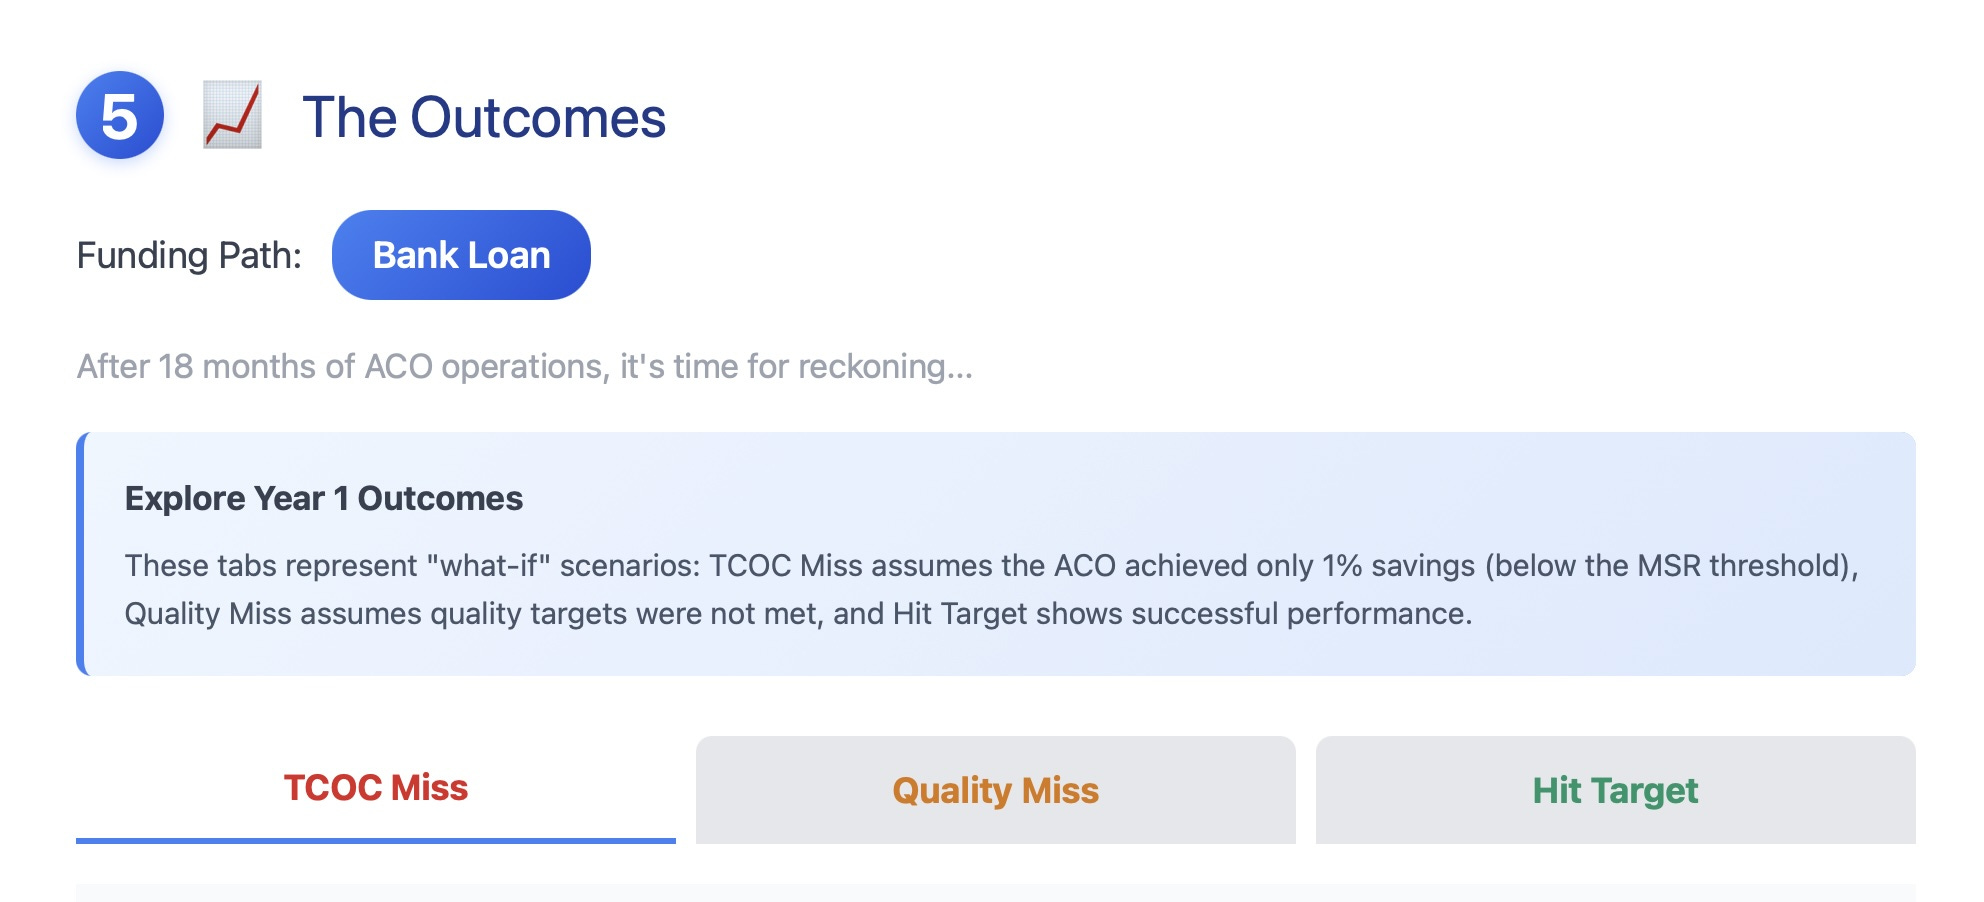
In the first two cases, unless the ACO secures additional funding, it will go bankrupt.
If the ACO succeeds, then it will receive gain-sharing payments from the payors. A part of these payments will be retained for ACO fixed cost operations, and the rest may be distributed to ACO physicians (typically PCPs) based on their distribution model.
Step 6: Projections
This step allows the user to project the ACO’s financial performance over several years (assuming the ACO succeeded in Year 1), either using the original assumptions or by modifying them on this page.
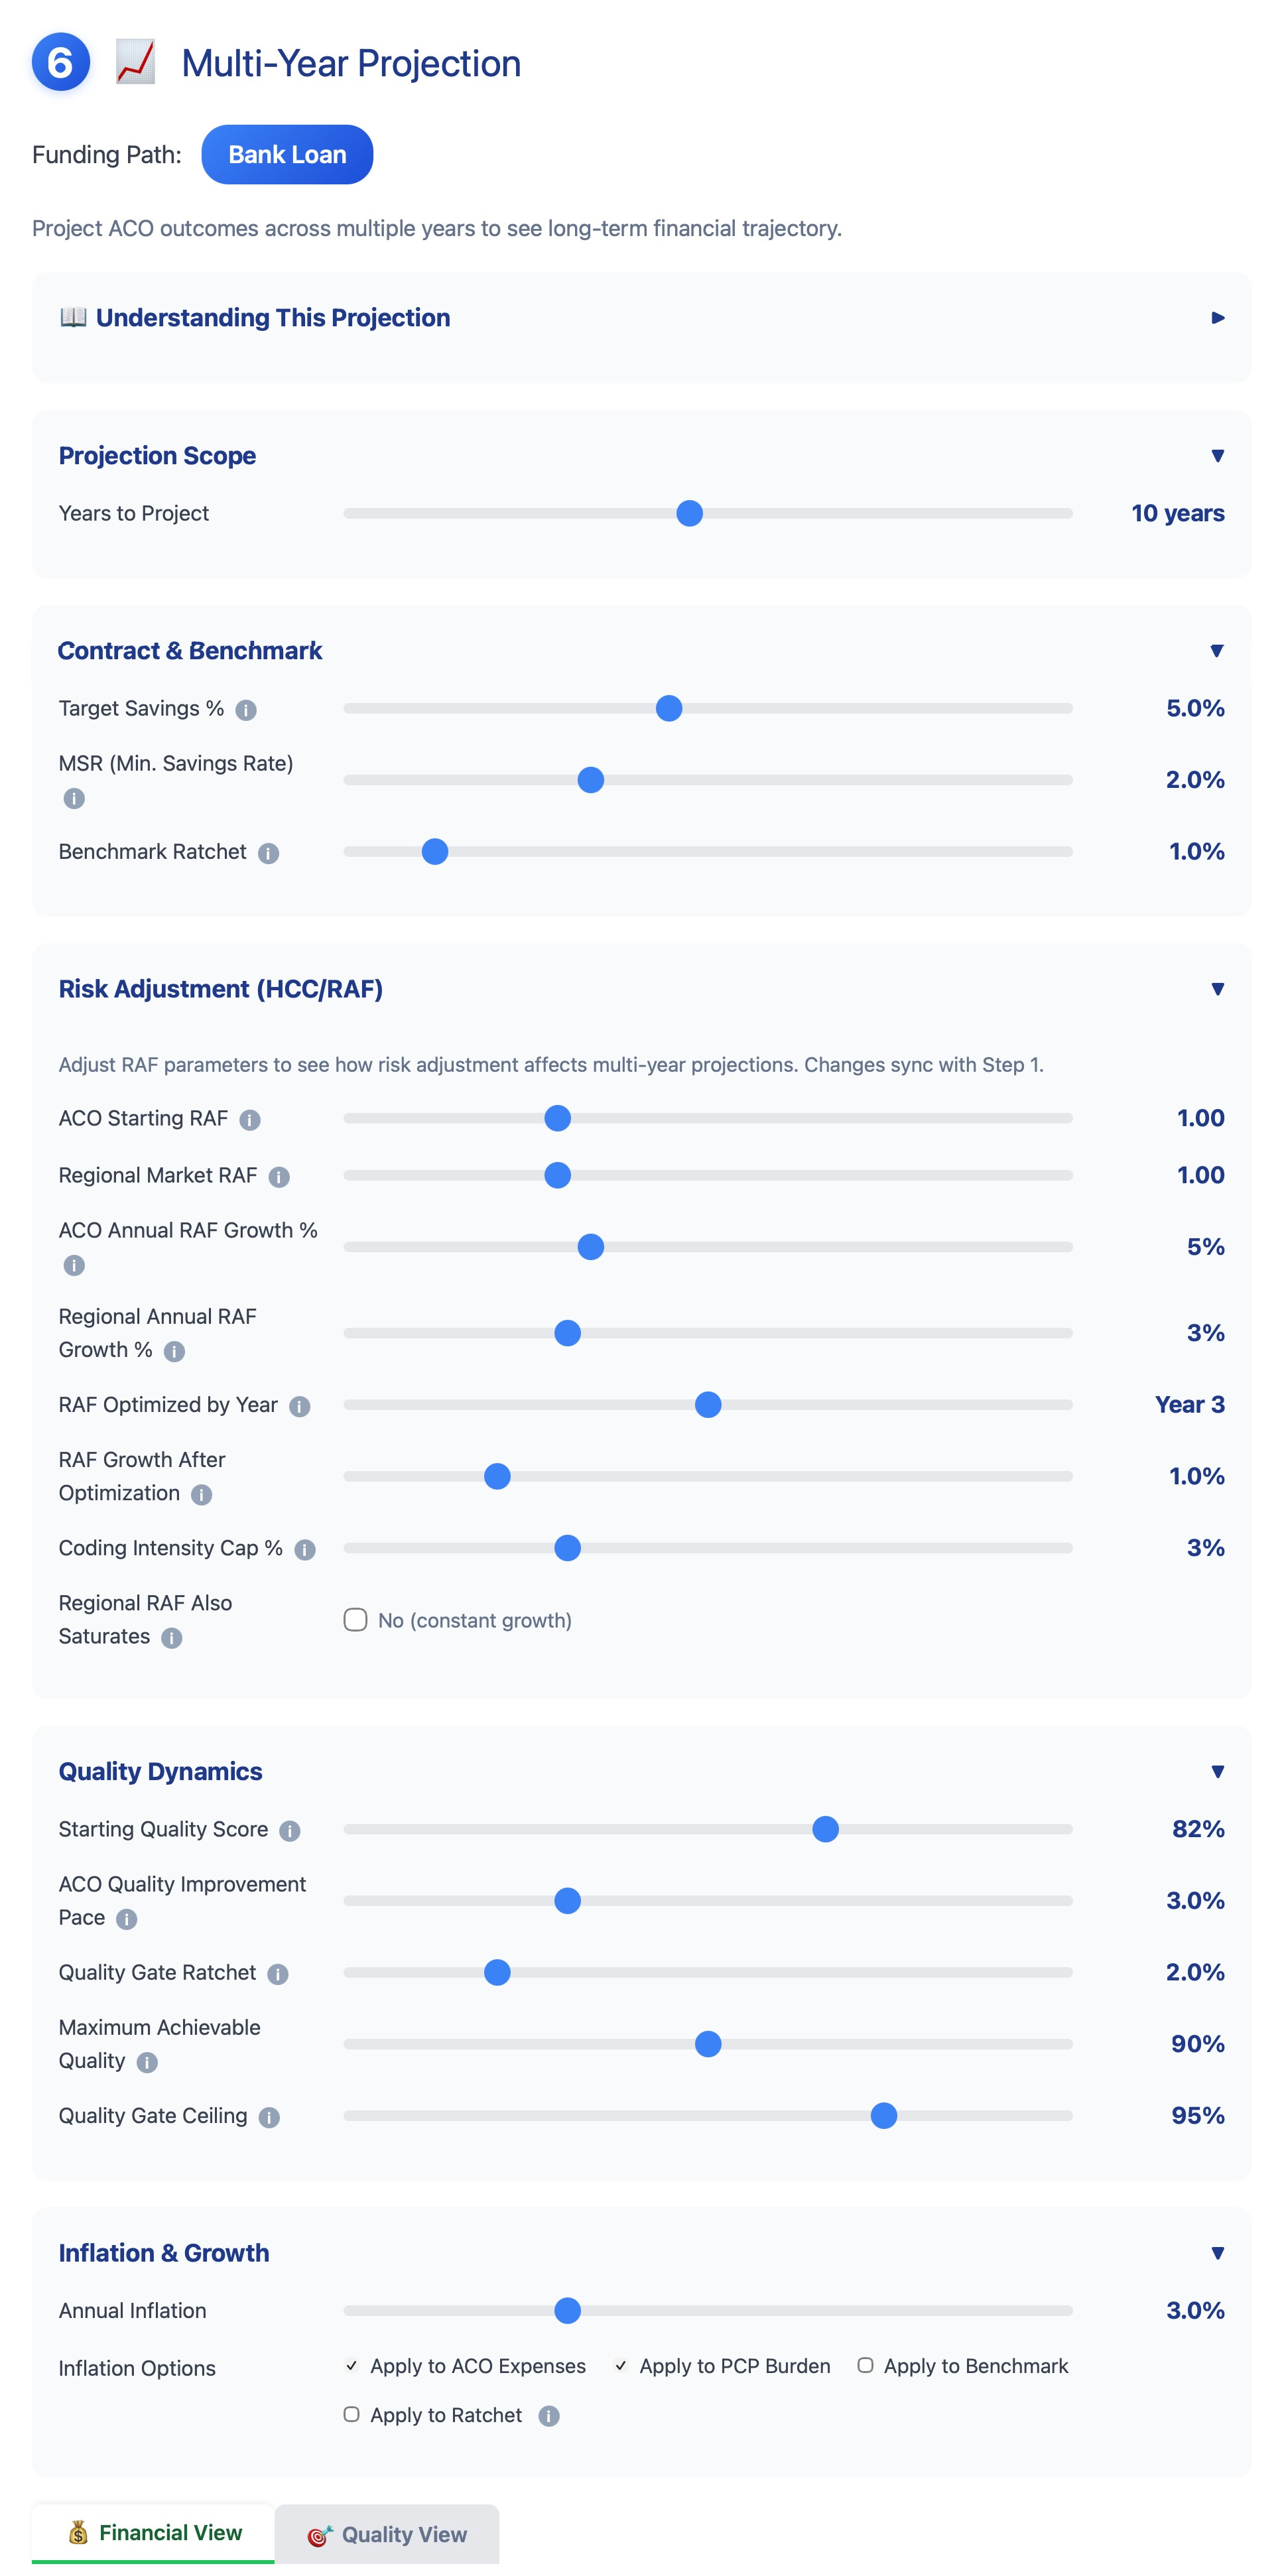
This step also introduces several new variables, such as:
Benchmark ratcheting: if ACO succeeds in reducing TCOC, the following year, the payors start ratcheting the benchmark. This means that it becomes harder for the ACO to reduce TCOC below the benchmark set by the payors.
HCC/RAF growth rate for both the ACO and regional market: i.e., how much sicker are your ACO patients compared to the regional market?
In other words, if the other ACOs are extremely aggressive in increasing their Risk Score, your ACO is at a disadvantage.
Quality gates ratcheting, i.e., every year the ACO is required to meet a higher quality threshold. This is generally harder for ACOs with independent practices, especially if they are on different EHRs
Step 7: Monte Carlo Simulation
All the steps above are based on the values of variables, i.e., assumptions that have been preselected, either by the user or by me.
Monte Carlo simulation is a technique that allows the user to run thousands of “what if” scenarios, each time varying the input assumptions. Using this technique, we can model the probability distribution of the ACO’s financial performance.
There are 2 types of Monte Carlo simulations:
Year 1
Multi-year (user can choose how many years)
The model randomizes variables in Year 1 thousands of times and then projects them forward for several years. It does not randomize variables Year 2 onwards.
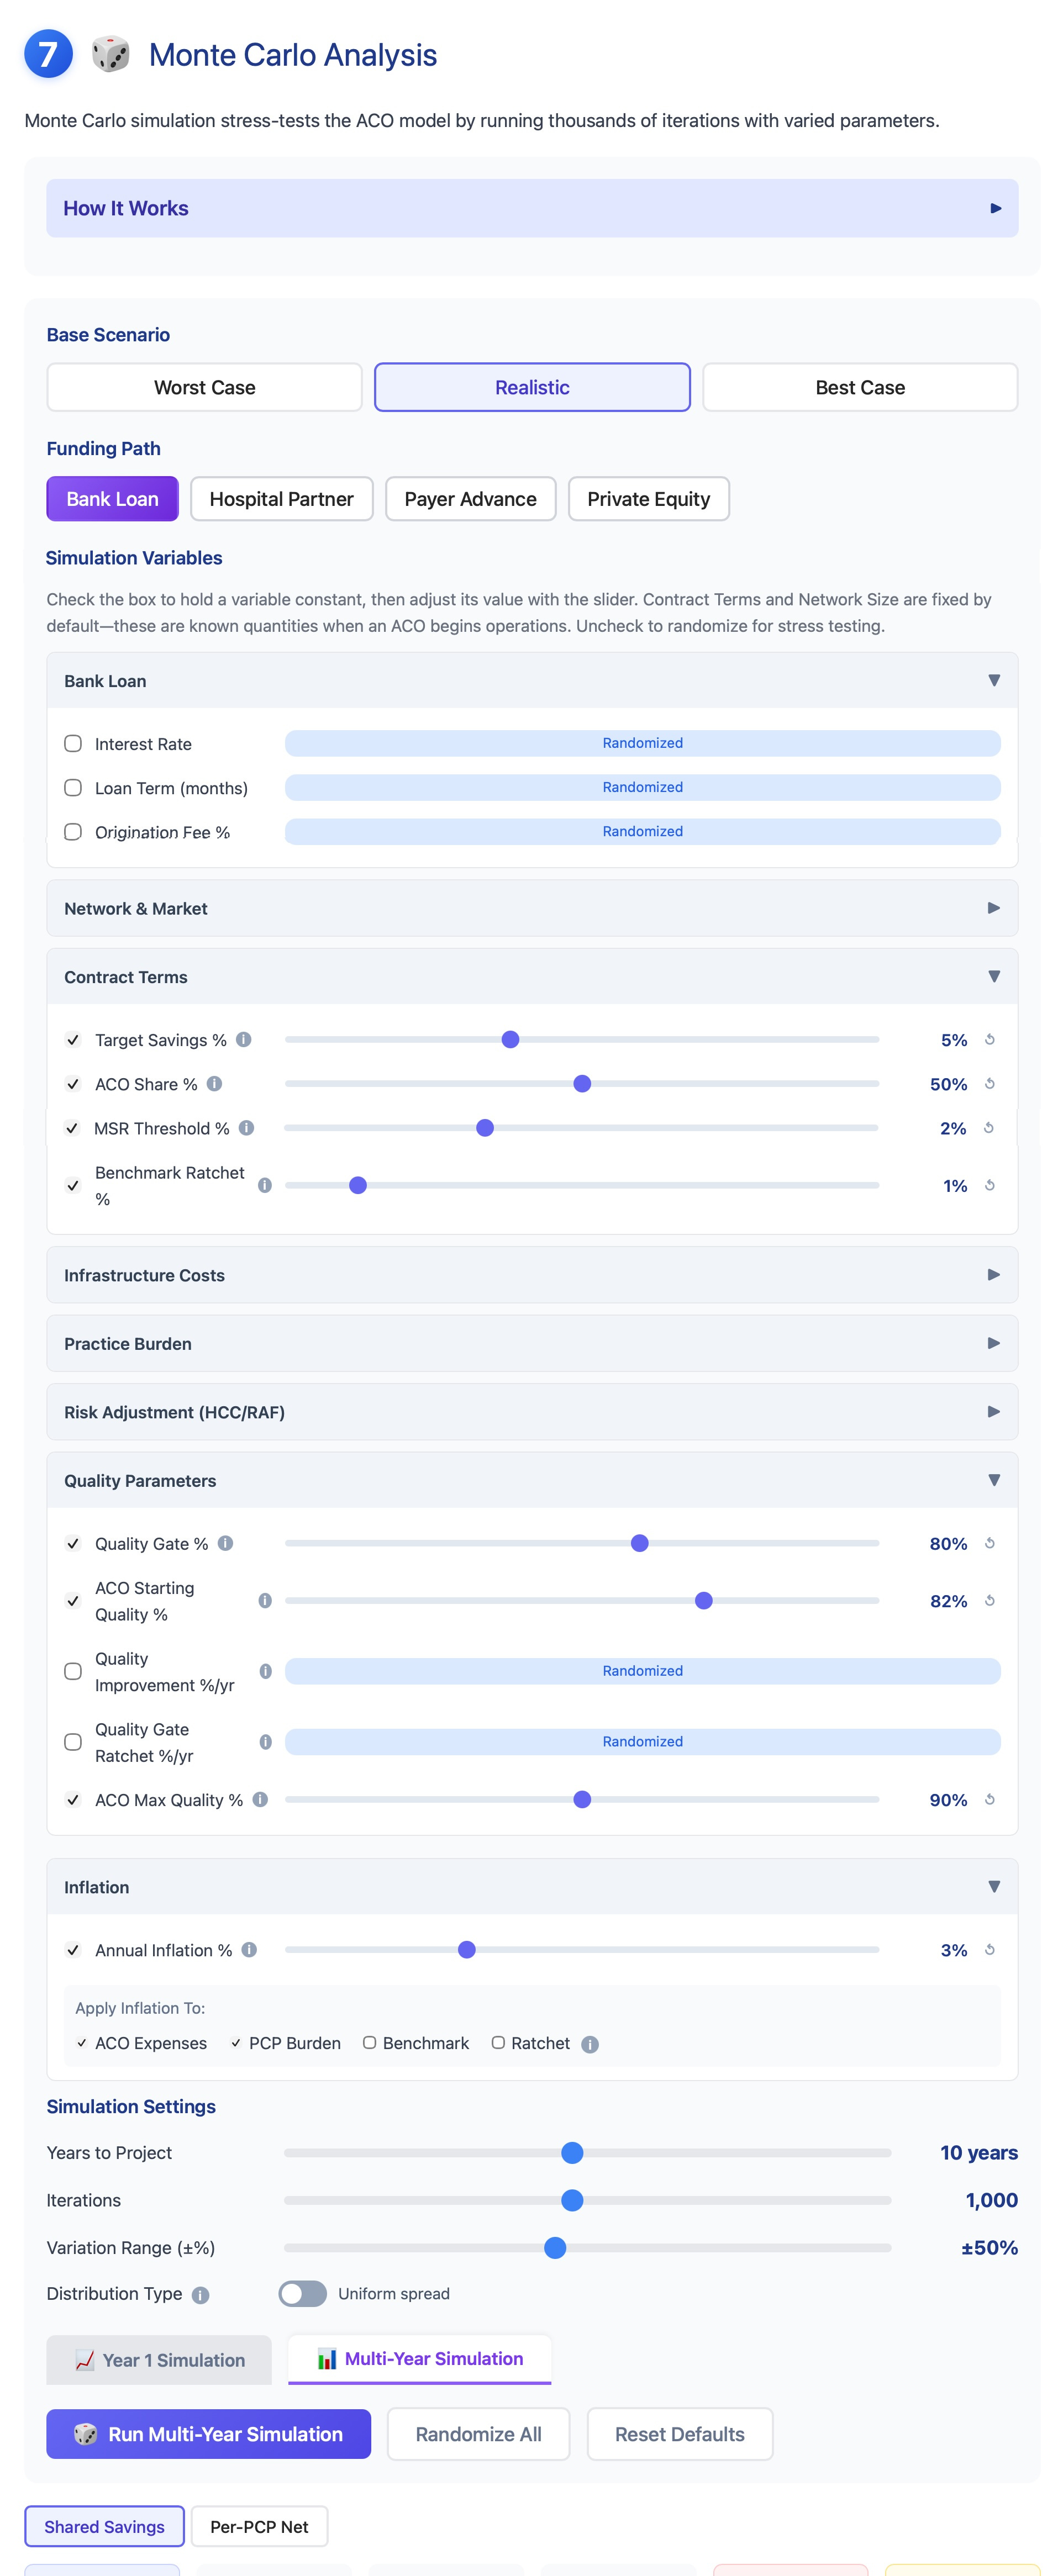
In these simulations, I have implemented the ability for the user to hold certain variables constant while randomizing others.
The Multi-year simulation models the ACO survival probability over several years, given the changing input variables and contractual terms. The model demonstrates that over 10-20 years, there is a high probability of ACO failure, which then leads to consolidation.
Final Thoughts
Hopefully, this simulation model will help people understand the complexity inherent in VBC and why it has been very challenging to scale VBC beyond CMS Medicare. Furthermore, the model demonstrates that gain sharing is often a function of contractual terms rather than of better care.
The simulation shows that most independent ACOs are financially engineered to fail over the long term, making acquisition by a hospital or private equity firm the only exit strategy.
If you have any feedback or suggestions to make the model better (or if I made any mistakes), please leave a comment below.
The model code is available on GitHub for review.
Up Next
In the next few articles and videos, I will take a deeper dive into individual funding models for the ACO and their trade-offs.
Hey Dr B . Primary doc of 40 years here . My practice is 9.5 FTE clinicians and we are in a large VBC . Our second VBC - the first 6 yrs with a local PHO supported us with some infrastructure in pharmacy and IT but not profit. So far the second , an ACO , has helped us several ways - both gross income and cash flow ( we are still trying to grow ) . But I have had my suspicions . Thanks for all the effort into this analysis. Got me thinking .