
Good Intentions, Bankrupt Doctors
VBC Simulation to Show Why Payor Funded ACOs Backfire

Before we start with the main topic of this newsletter, I wanted to share a recent article that was published in Health Affairs Forefront discussing CMS’s new ACCESS program.
ACCESS: A Fix For Digital Health Companies, Not Medicare’s Costliest Patients
This article was a collaboration between:
Morish Shah, MS in Precision Health student at the University of Chicago and co-founder and executive director of Project UNITY.
Graham Walker, MD, emergency medicine physician in San Francisco and co-founder of MDCalc and Offcall.
Yours truly, Sudeep Bansal, MD, MS
With that out of the way, let’s get back to the main topic of this newsletter.
In the last two newsletters, I used my Value-Based Care (VBC) simulation model to discuss outcomes when an independent ACO (with independent primary care physicians) self-funds its operations or partners with a health system.
If you have not “played” with the simulation model, I highly recommend doing so using the link below.
In this newsletter, I will look at the repercussions of the ACO partnering with a health insurance company.
Let’s dive in.
The video version of this article is embedded below and available on my YouTube Channel.
The audio podcast and video versions are also available on the Podcasts Page.
Why would an insurance company fund an ACO?
Insurance companies (especially Medicare Advantage plans) have a vested interest in decreasing the total cost of care (TCOC) and increasing the risk adjustment factor (RAF) score.
A RAF score increases the benchmark, which is the projection of how much TCOC should be in the measurement year.
And:
Profits = Benchmark - TCOC
With this background, let’s look at the simulation model.
If you have read the last 2 newsletters and are familiar with the simulation, you can jump to Step 4.
The Simulation Model
There are 7 steps in the model. Each step has several variables that the user can adjust. I have made baseline assumptions for each variable, including worst-case, realistic, and best-case scenarios. In addition, many variables include tooltips that explain their meaning.
For this article/demonstration, I will follow the realistic scenario in the VBC Simulation Model.
Steps 1-3
The steps are the same as in my last article. They include:
Setup: Allows the user to choose the ACO size and baseline contract terms.
S
Opportunity (Pot of Gold): Shows the back-of-the-envelope ACO savings opportunities based on the assumptions in Step 1.
, $10,000 TCOC per patient, $800 million attributed TCOC, 5% target savings ($40 million), 50% ACO gain share resulting in $20 million total ACO share or $200,000 per PCP.")
Reality Sets In: Simulates the costs of setting up the ACO. This step also includes the PCP’s financial burden from the added administrative tasks.
, Monthly ACO Burn rate ($174K), and Per PCP financial burden over 18 months ($86K).")
By the end of Step 3, our newly formed ACO needs approximately $3.1 million for the first 18 months to function. In addition, individual PCPs have lost the opportunity to earn approx $86K in these 18 months.
Step 4: The Funding Decision
With $3.1M needed to operate the ACO, the next question is: who provides the capital? In this step, we decide which funder to choose from:
Bank Loan
Hospital partner
Payer Advance (as pmpm)
Private Equity
Since we will focus on Payer Advance (Prospective PMPM), when we click that option, we get the following screen.
(PMPM = Per Member Per Month)
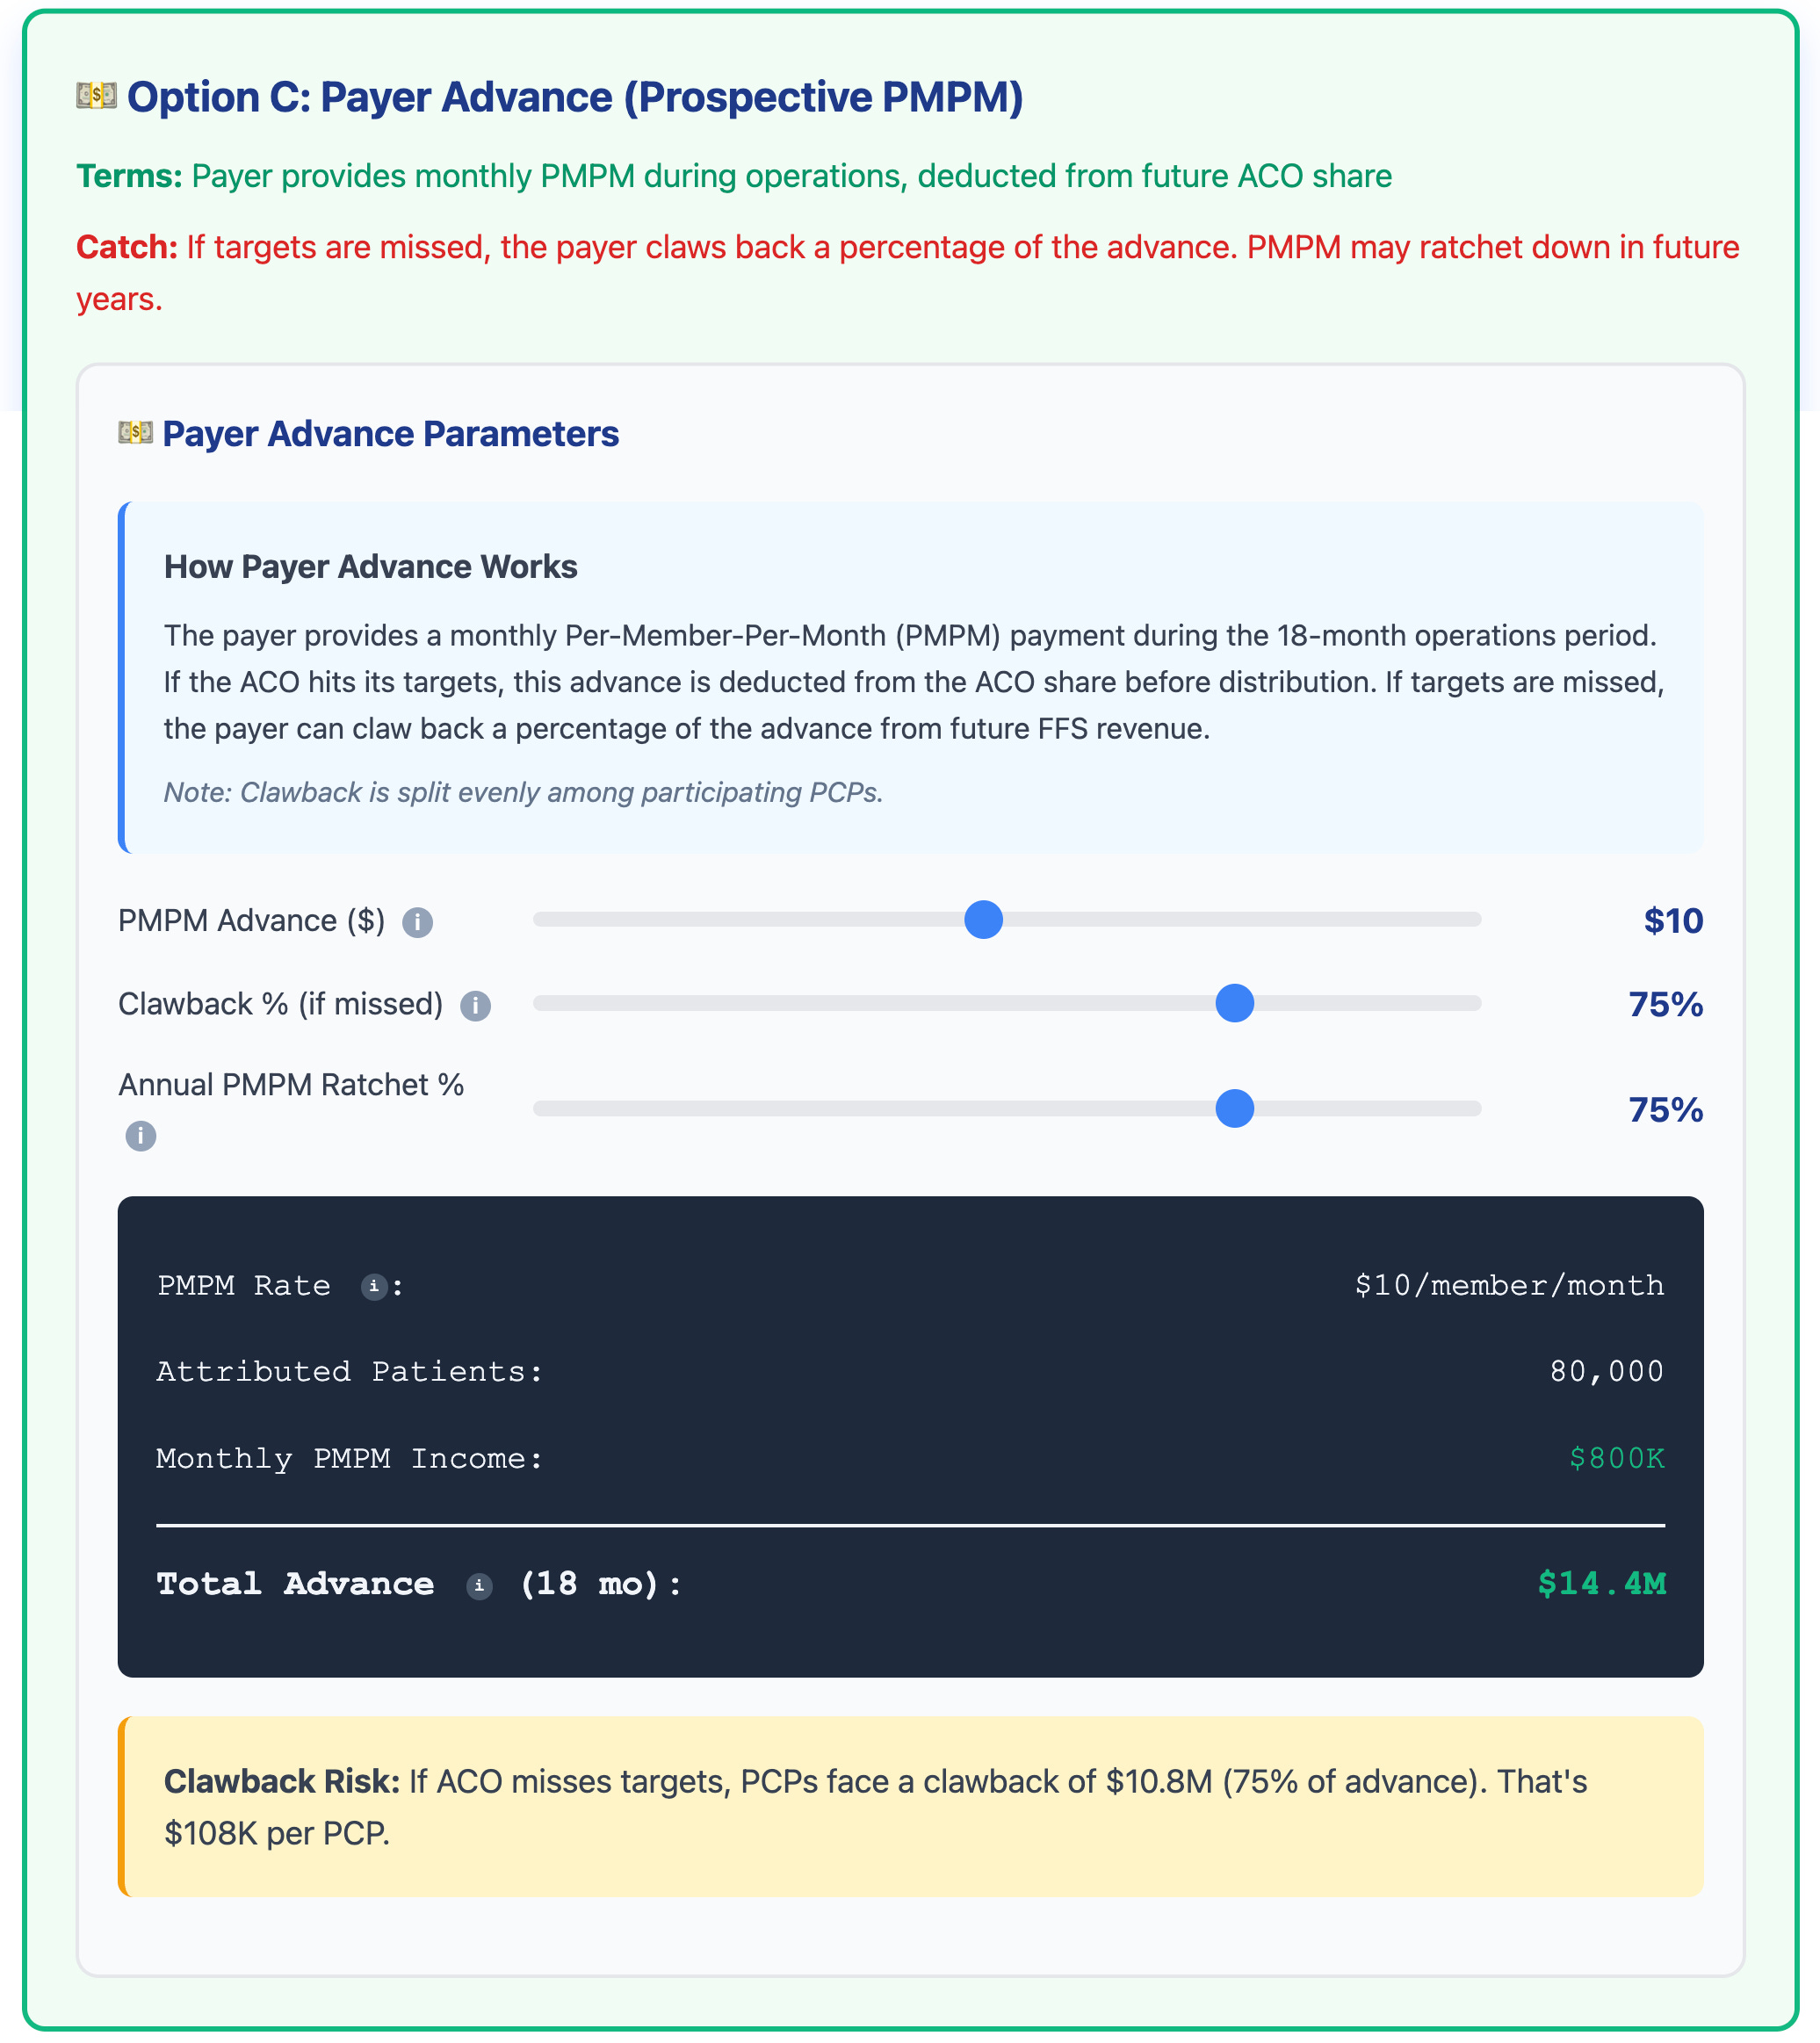
If you look at the screenshot above, the payor is willing to fund the ACO $14.4M over 18 months, well over the $3.1M needed. However, there are 2 catches:
Clawback %: The insurance company will claw back 75% of the advance, either:
From the ACO gain share, if the ACO reduces TCOC
From future FFS payments, if ACO does not reduce TCOC
Annual PMPM Ratchet: Since the payor is fronting a huge amount of money, they will ratchet down the amount next year, as the goal is to “jump start” the ACO.
Another way to think about this is that the payor is giving the ACO a “generous” 0% loan to get started.
And to be fair, from the insurance company’s perspective, these terms are reasonable. So now let’s look at Year 1 outcomes.
Step 5: Year 1 Outcomes
Let’s look at the model's screenshot to see what happens if the ACO fails to reduce TCOC.
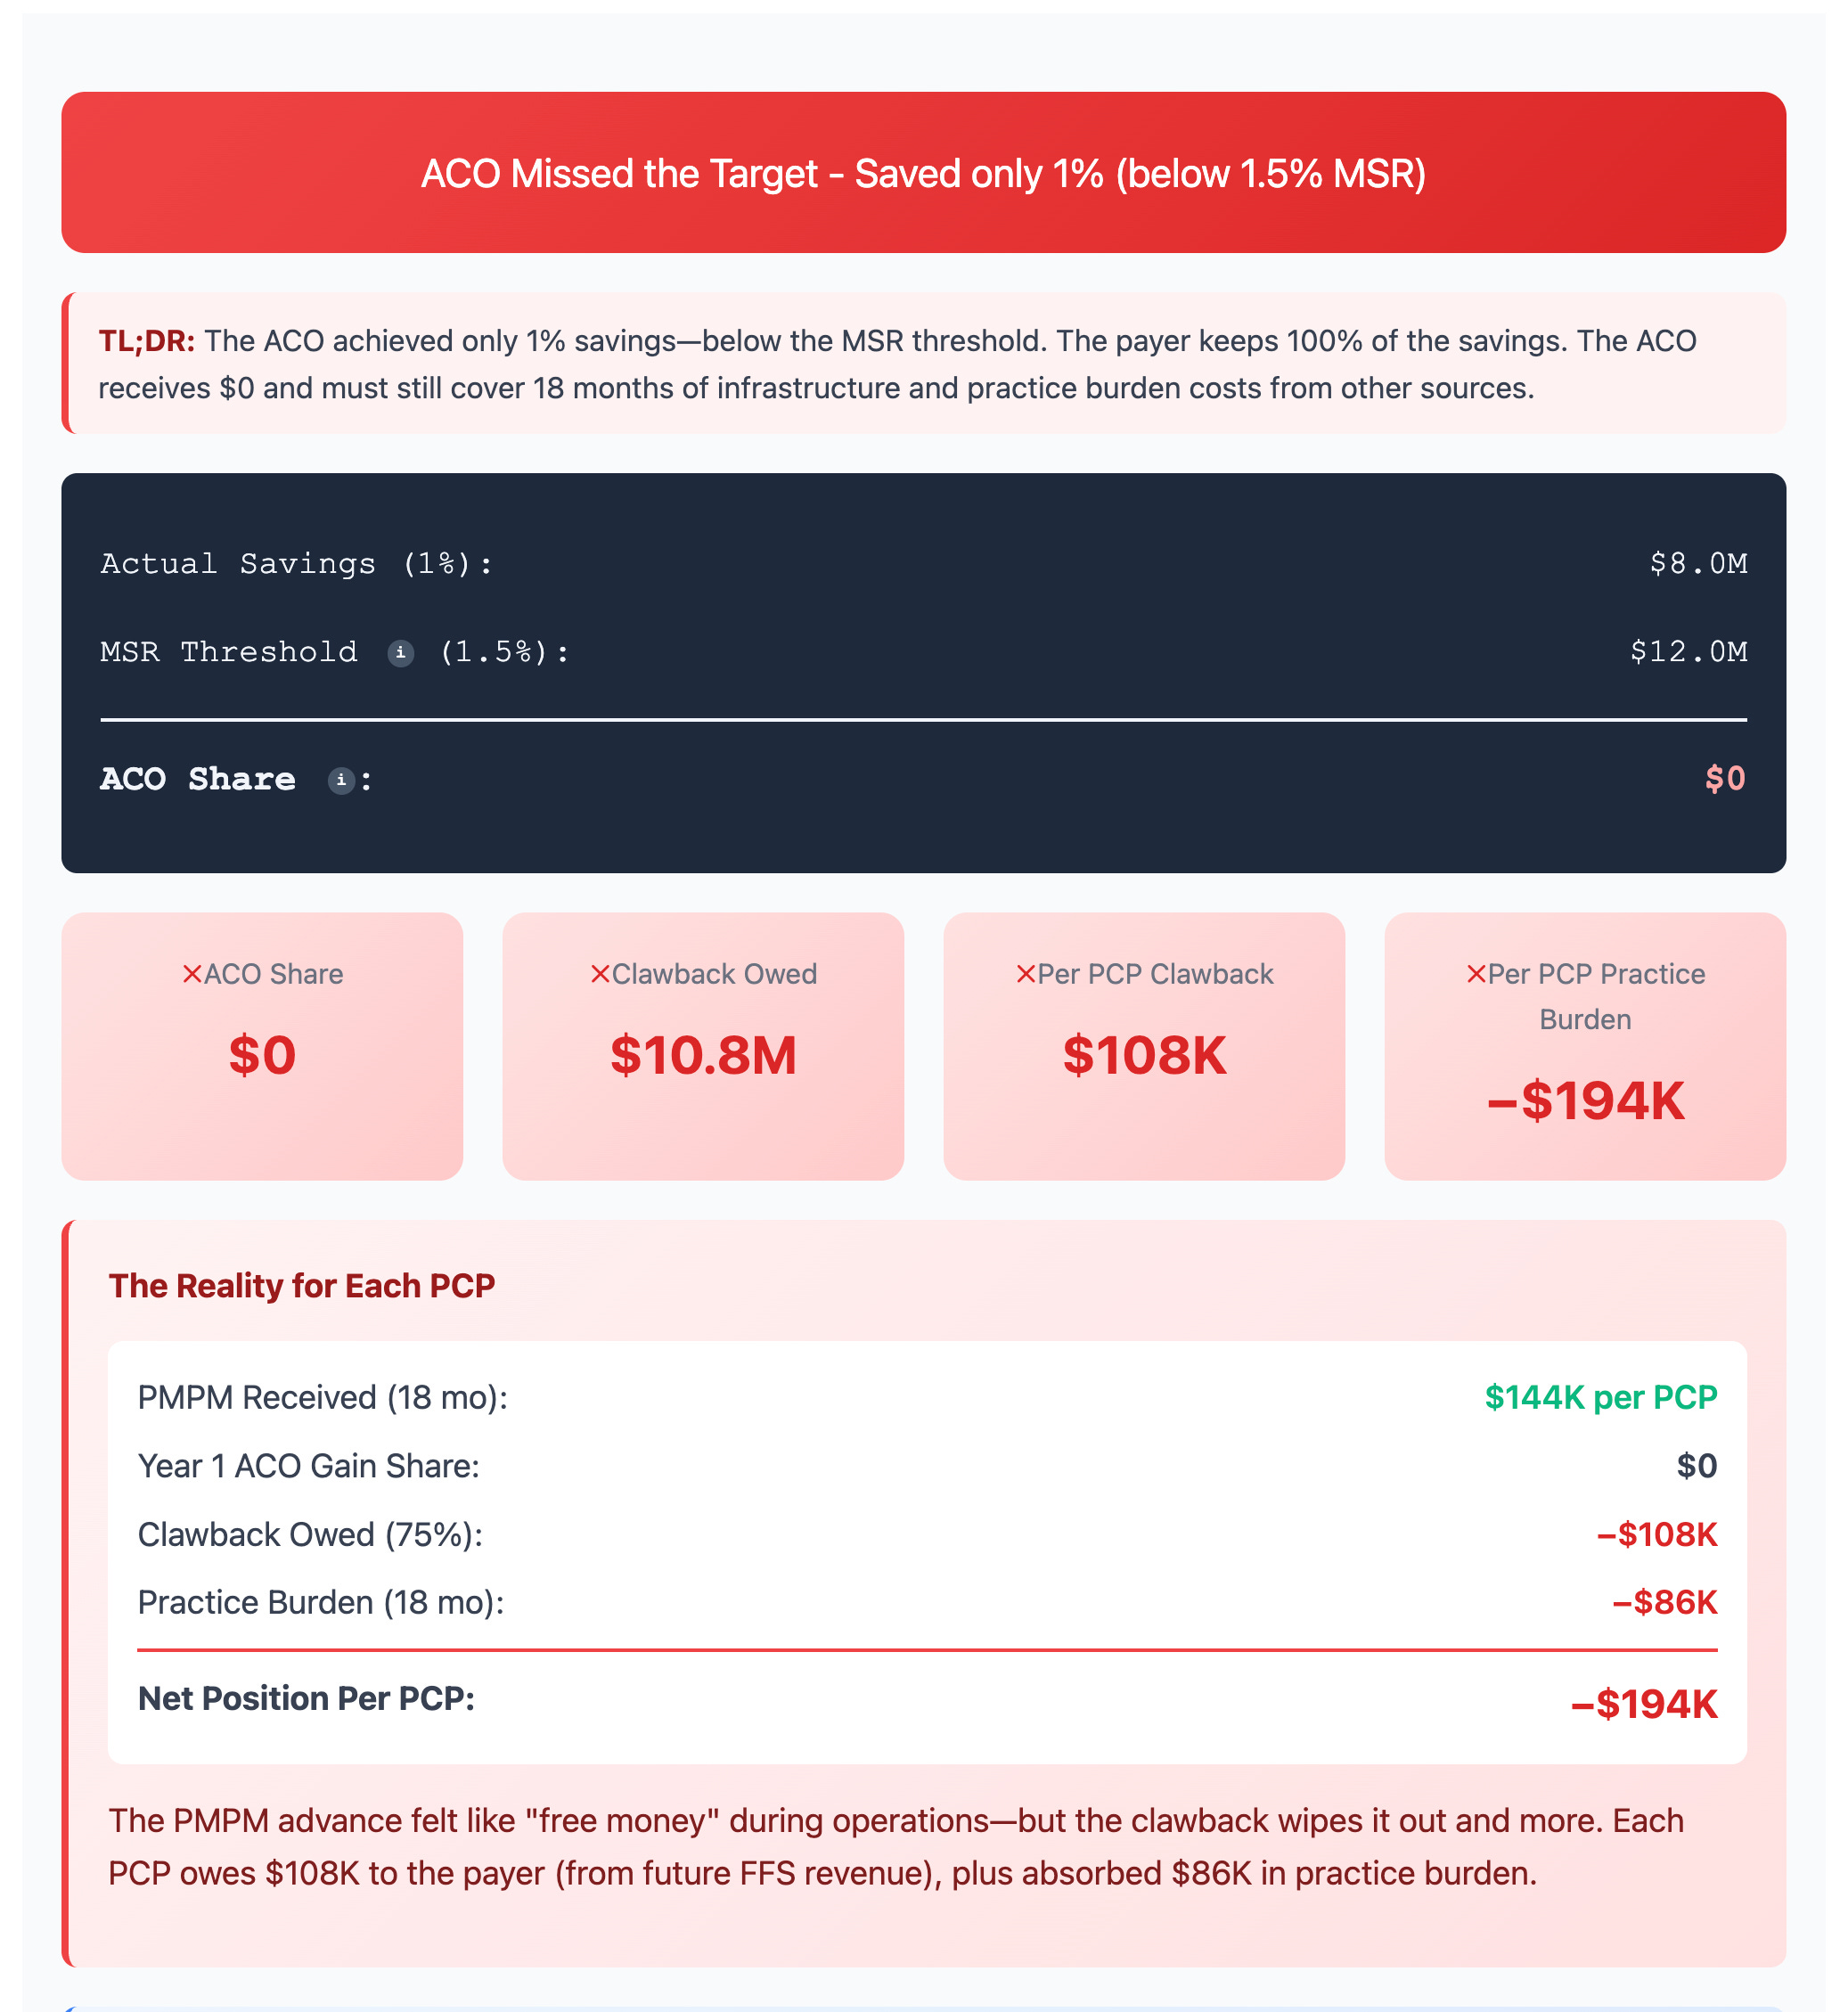
The best way to describe this scenario is: a bloodbath.
The potential $200,000 bonus ultimately becomes a liability ($194k in the screenshot above). And what looked like a generous offer from the insurance company could wipe out PCP practices by putting them into debt.
By the way, the reason why this scenario is very unlikely in real life is that most practices have a mix of payors, so only a fraction of the modeled 1000 patients would fall under this kind of scenario. The reason I chose this model is to drive home the point of how value-destructive these contracts can be.
But what happens if the ACO does succeed in reducing TCOC? Let’s look at the screenshot below.
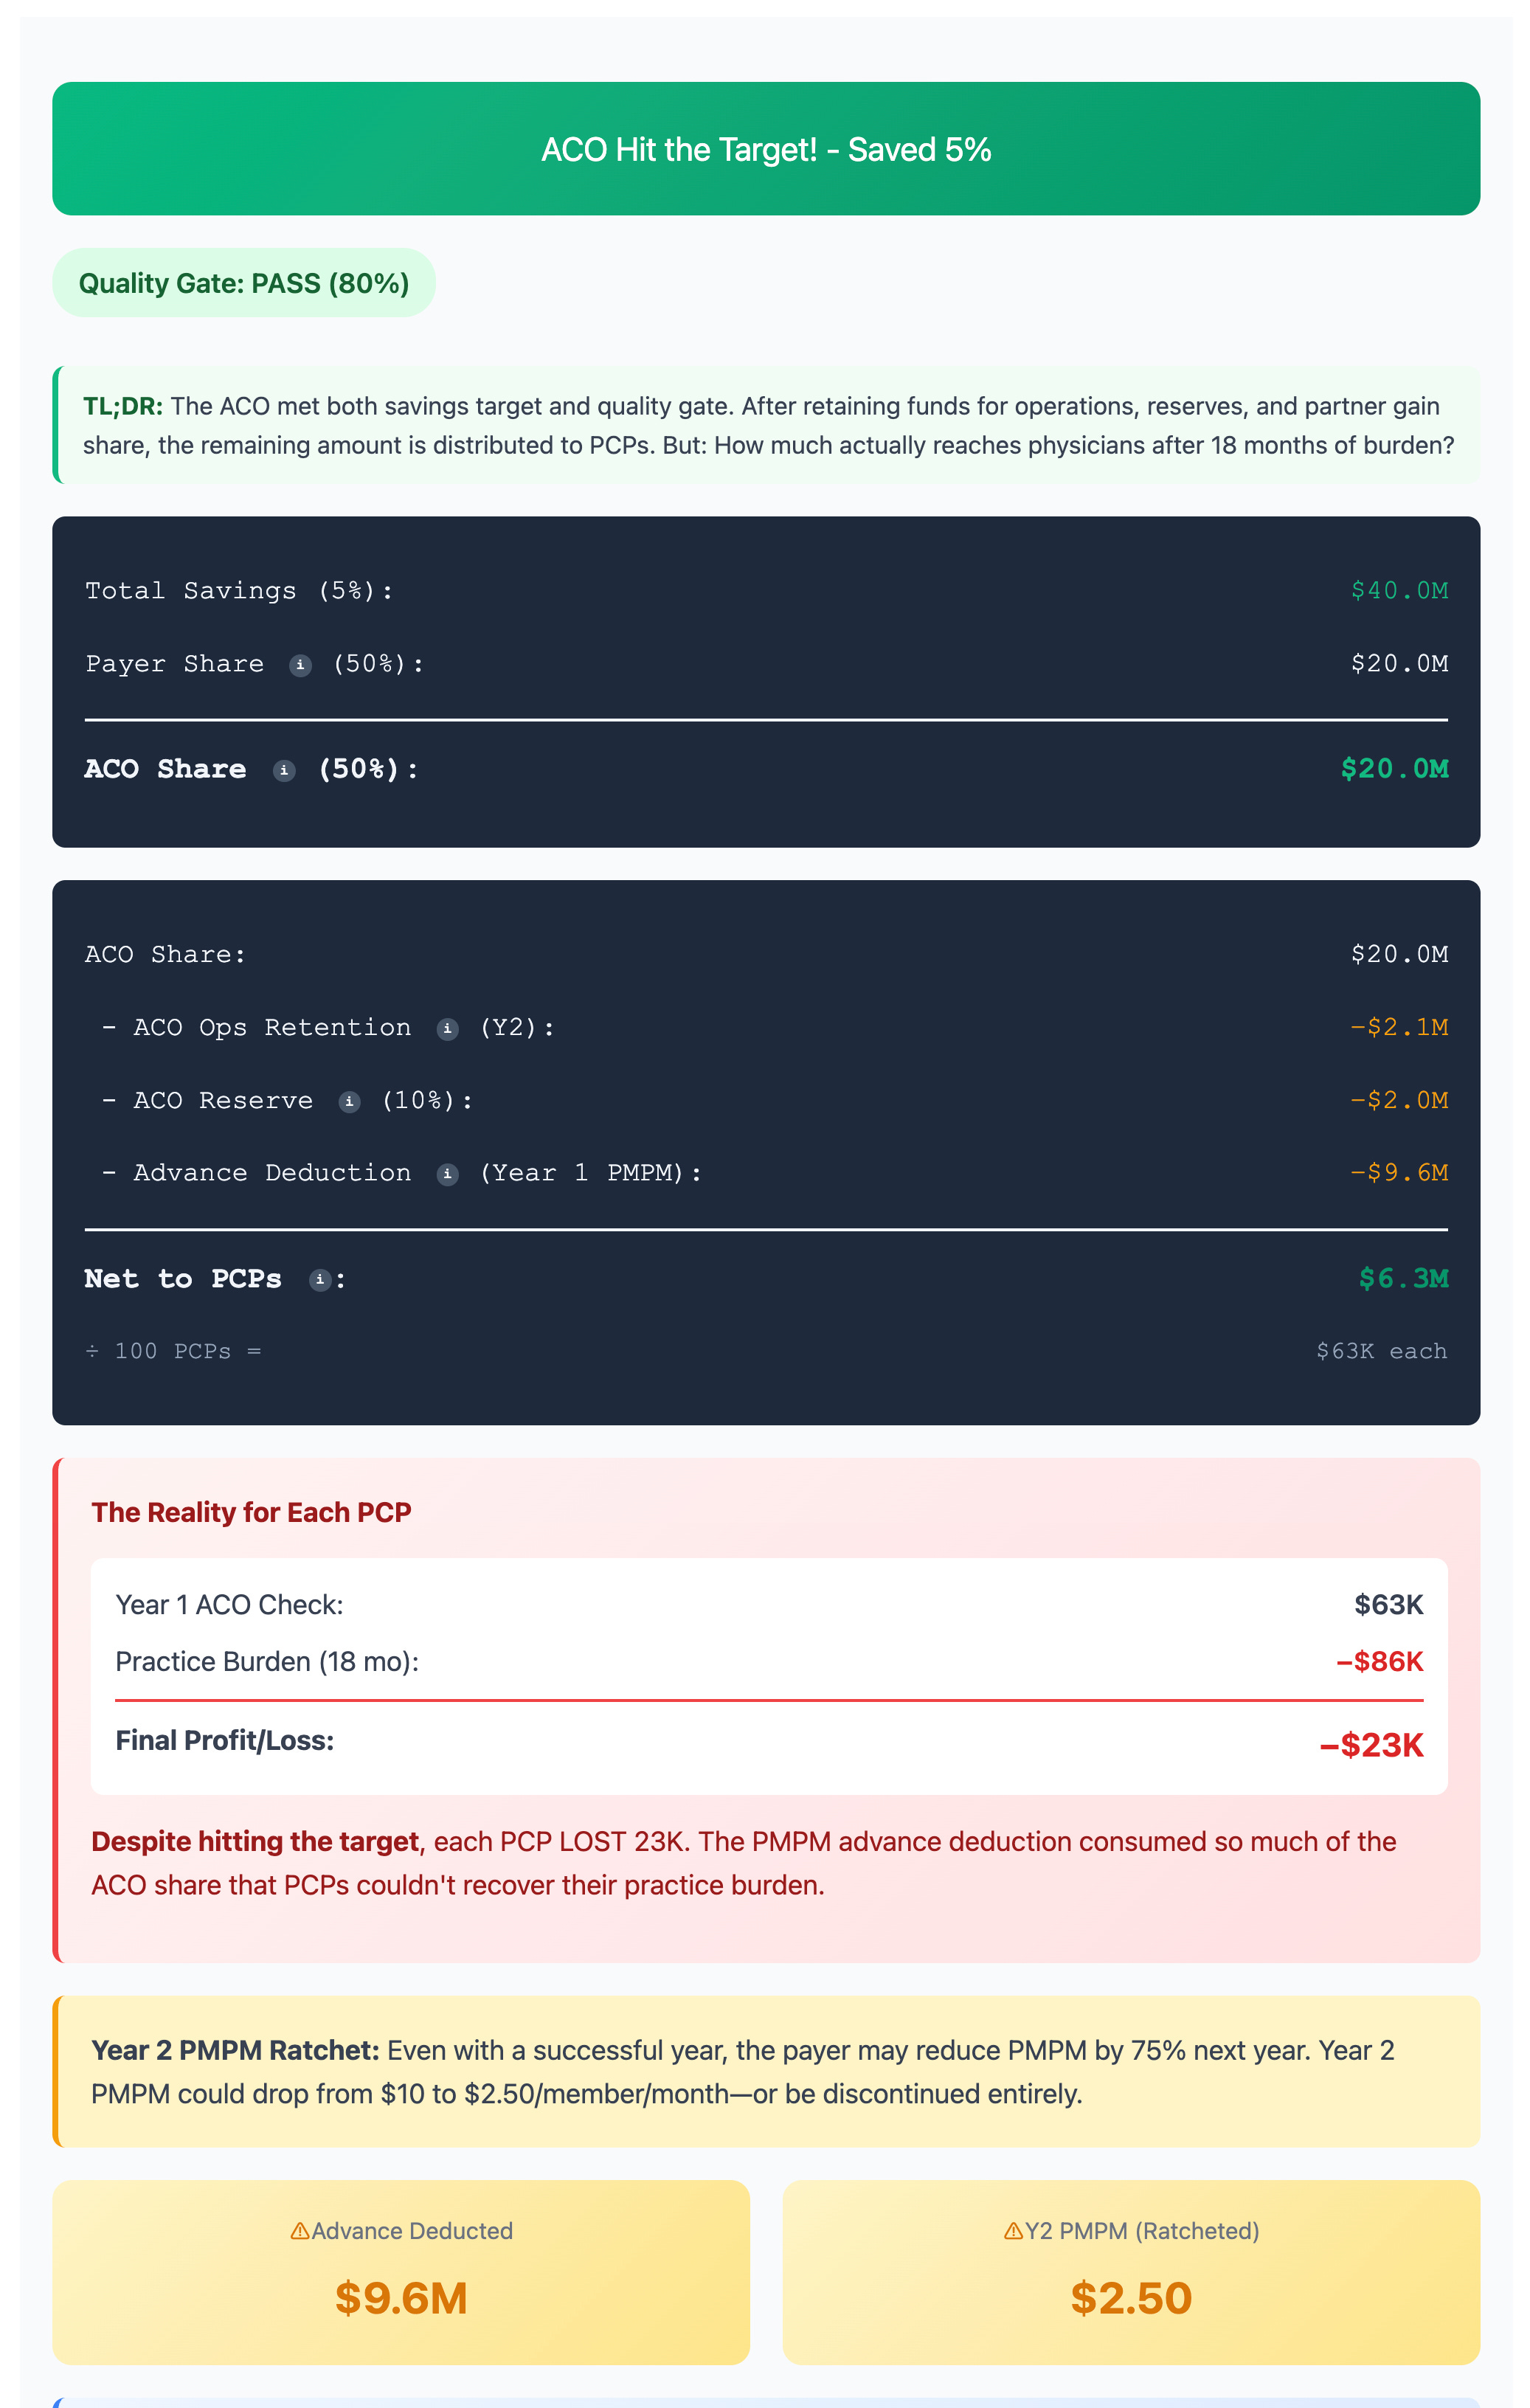
The ACO saved money, but had to pay the insurance company back 75% of the advance. This dramatically reduces gain share to the ACO. Furthermore, the ACO needs to keep some of the gain share for next year’s operations and also for reserves, further reducing gain share that the PCP practices will receive.
By the time the money reaches the PCP practices, it is not enough to cover the opportunity cost of just seeing patients. Per the model, in spite of the ACO reducing TCOC, each PCP still loses $23,000!
And when we project these outcomes, the reality is even more grim.
Step 6: Multi-Year Projections
Given the assumptions under the realistic scenario, most ACOs will fail within a decade.
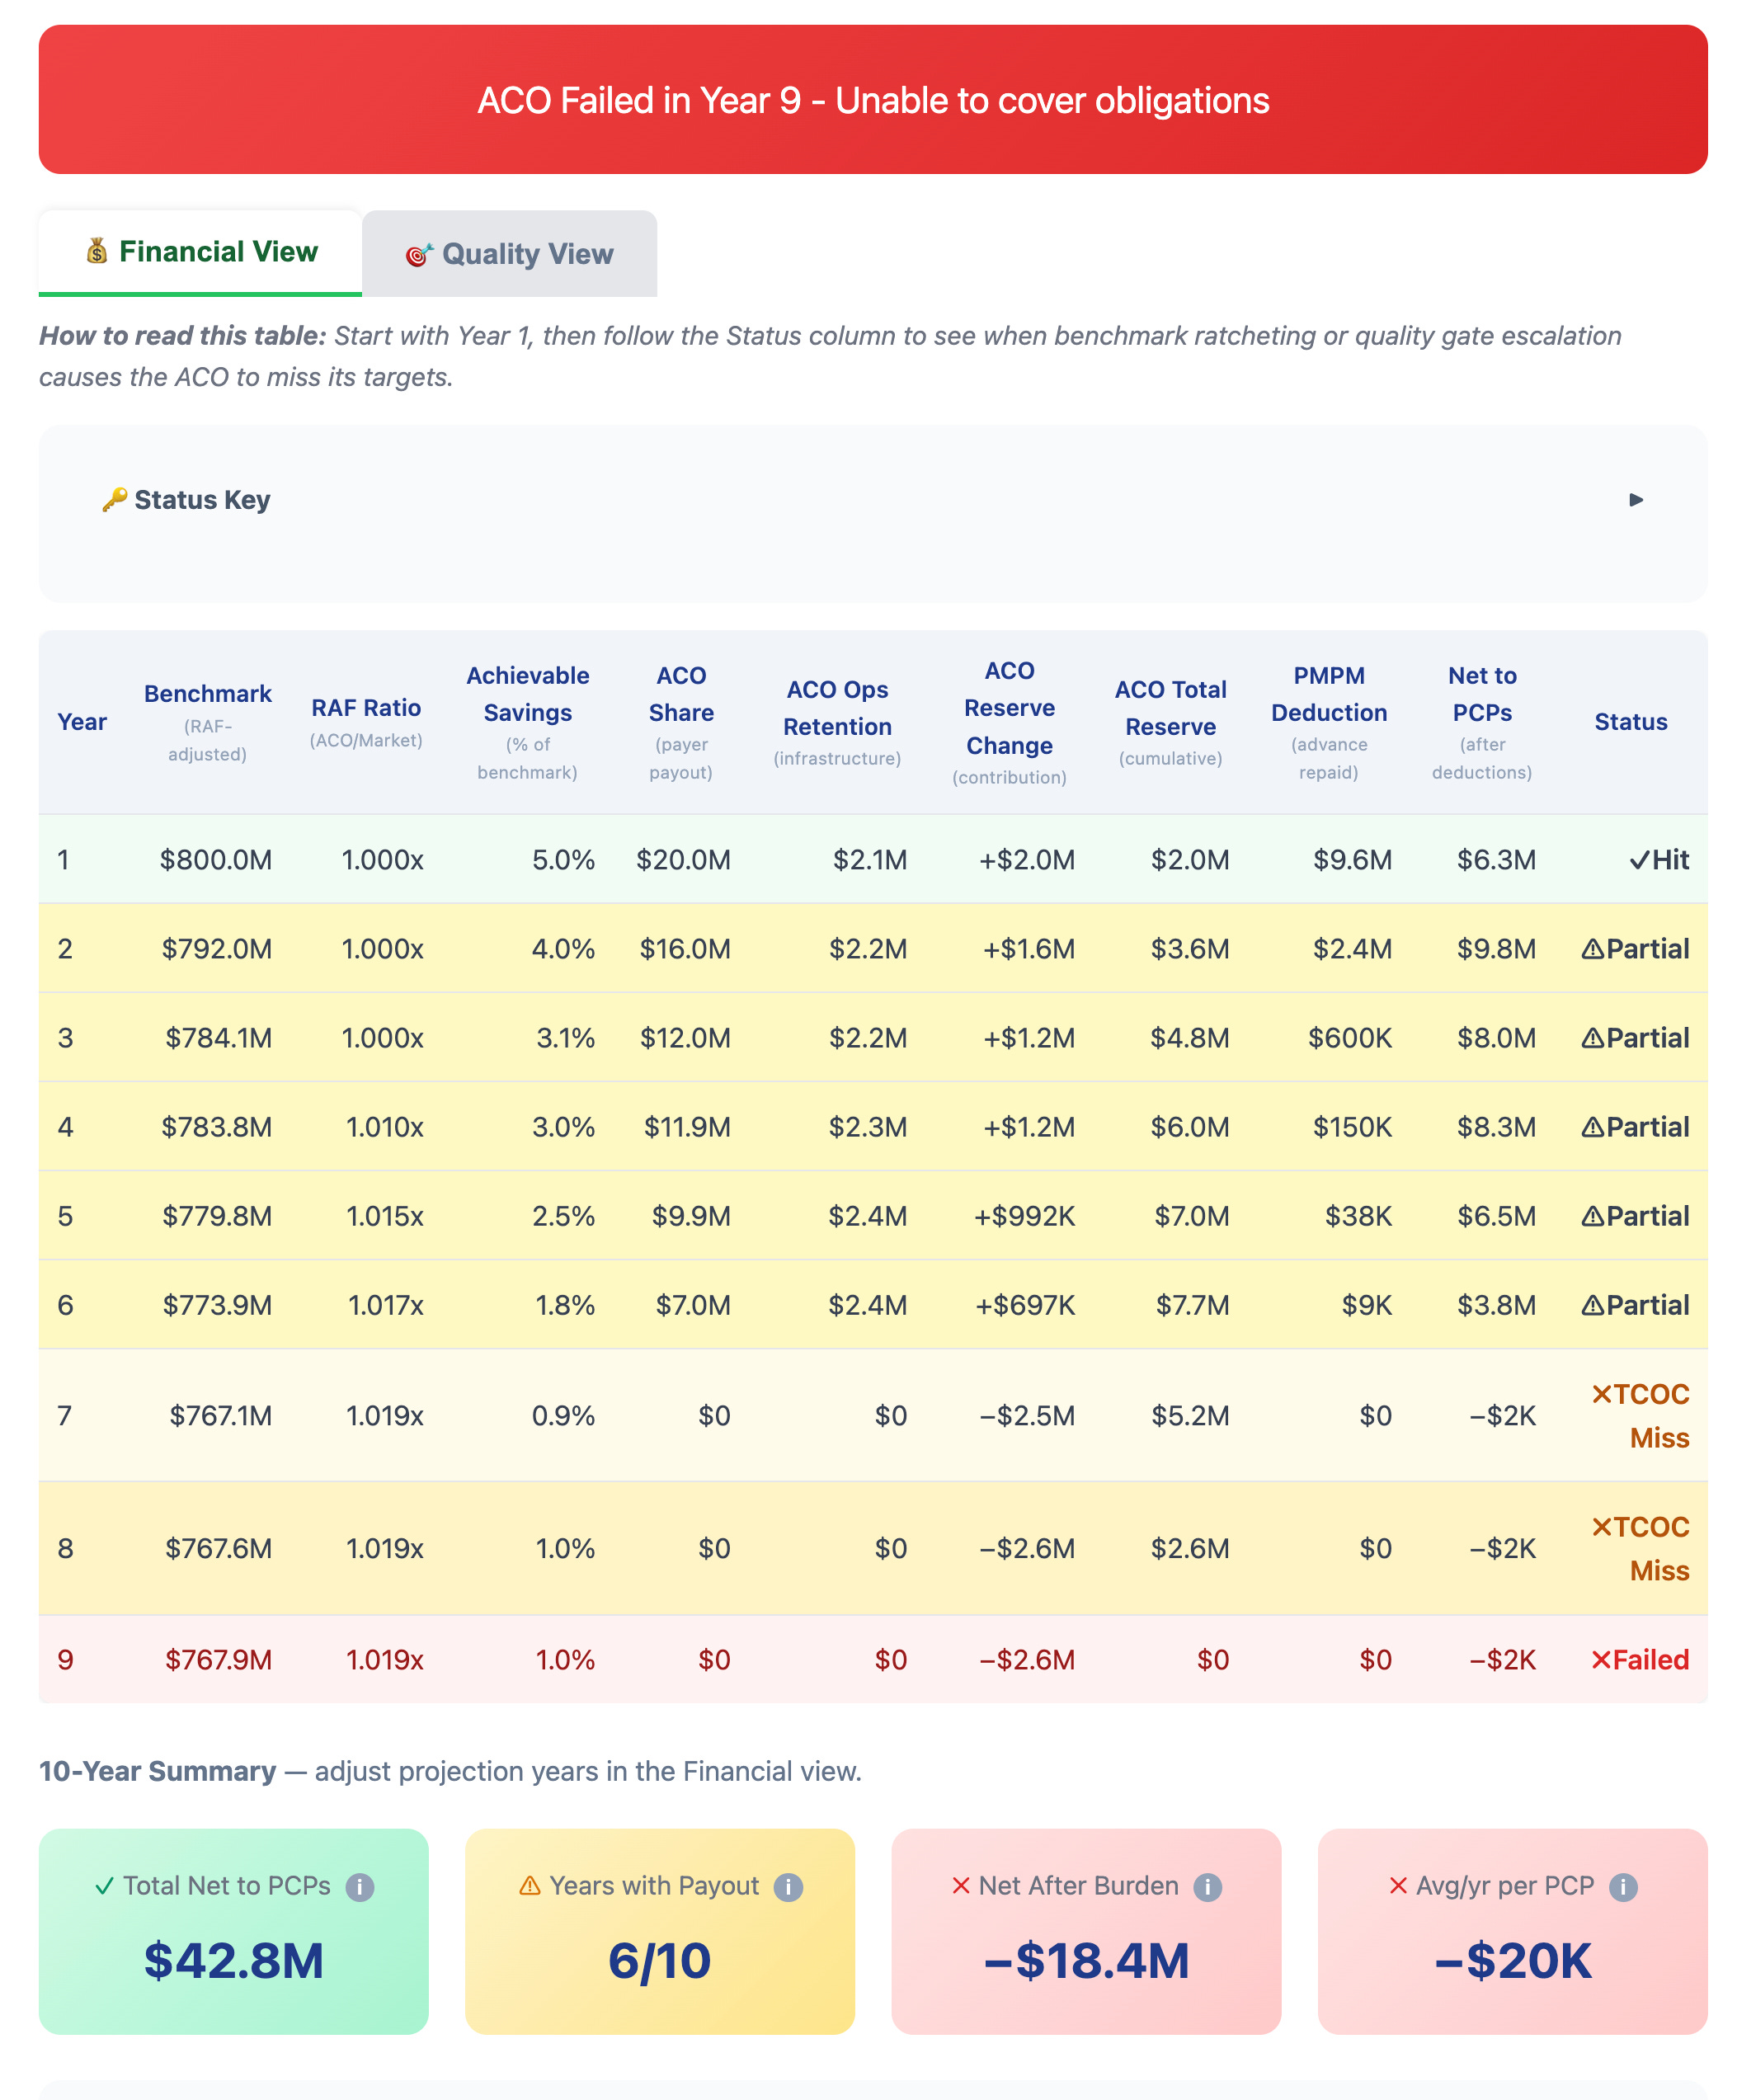
What is interesting to note is that it is often touted how much money these programs pass on to support PCPs. And at first glance, it looks like a lot - $42.8M in 9 years. But gross revenues are not profits.
Once you factor in the opportunity costs, each PCP loses an average of $20k per year. If we factor in inflation and declining Fee-for-Service reimbursement, you can see why most independent PCPs eventually go out of business.
Step 7: Monte Carlo Simulation
The above analysis is based on realistic inputs that I chose. A reasonable push back would be that those assumptions are too pessimistic. This is where the Monte Carlo simulation comes in.
In the simulation model, we baked in that the ACO will survive in the 1st year. So when we run Monte Carlo, we expect the results to be good for the ACO in the 1st year. But the story is very different for independent PCPs. Let’s look at the screenshot below.
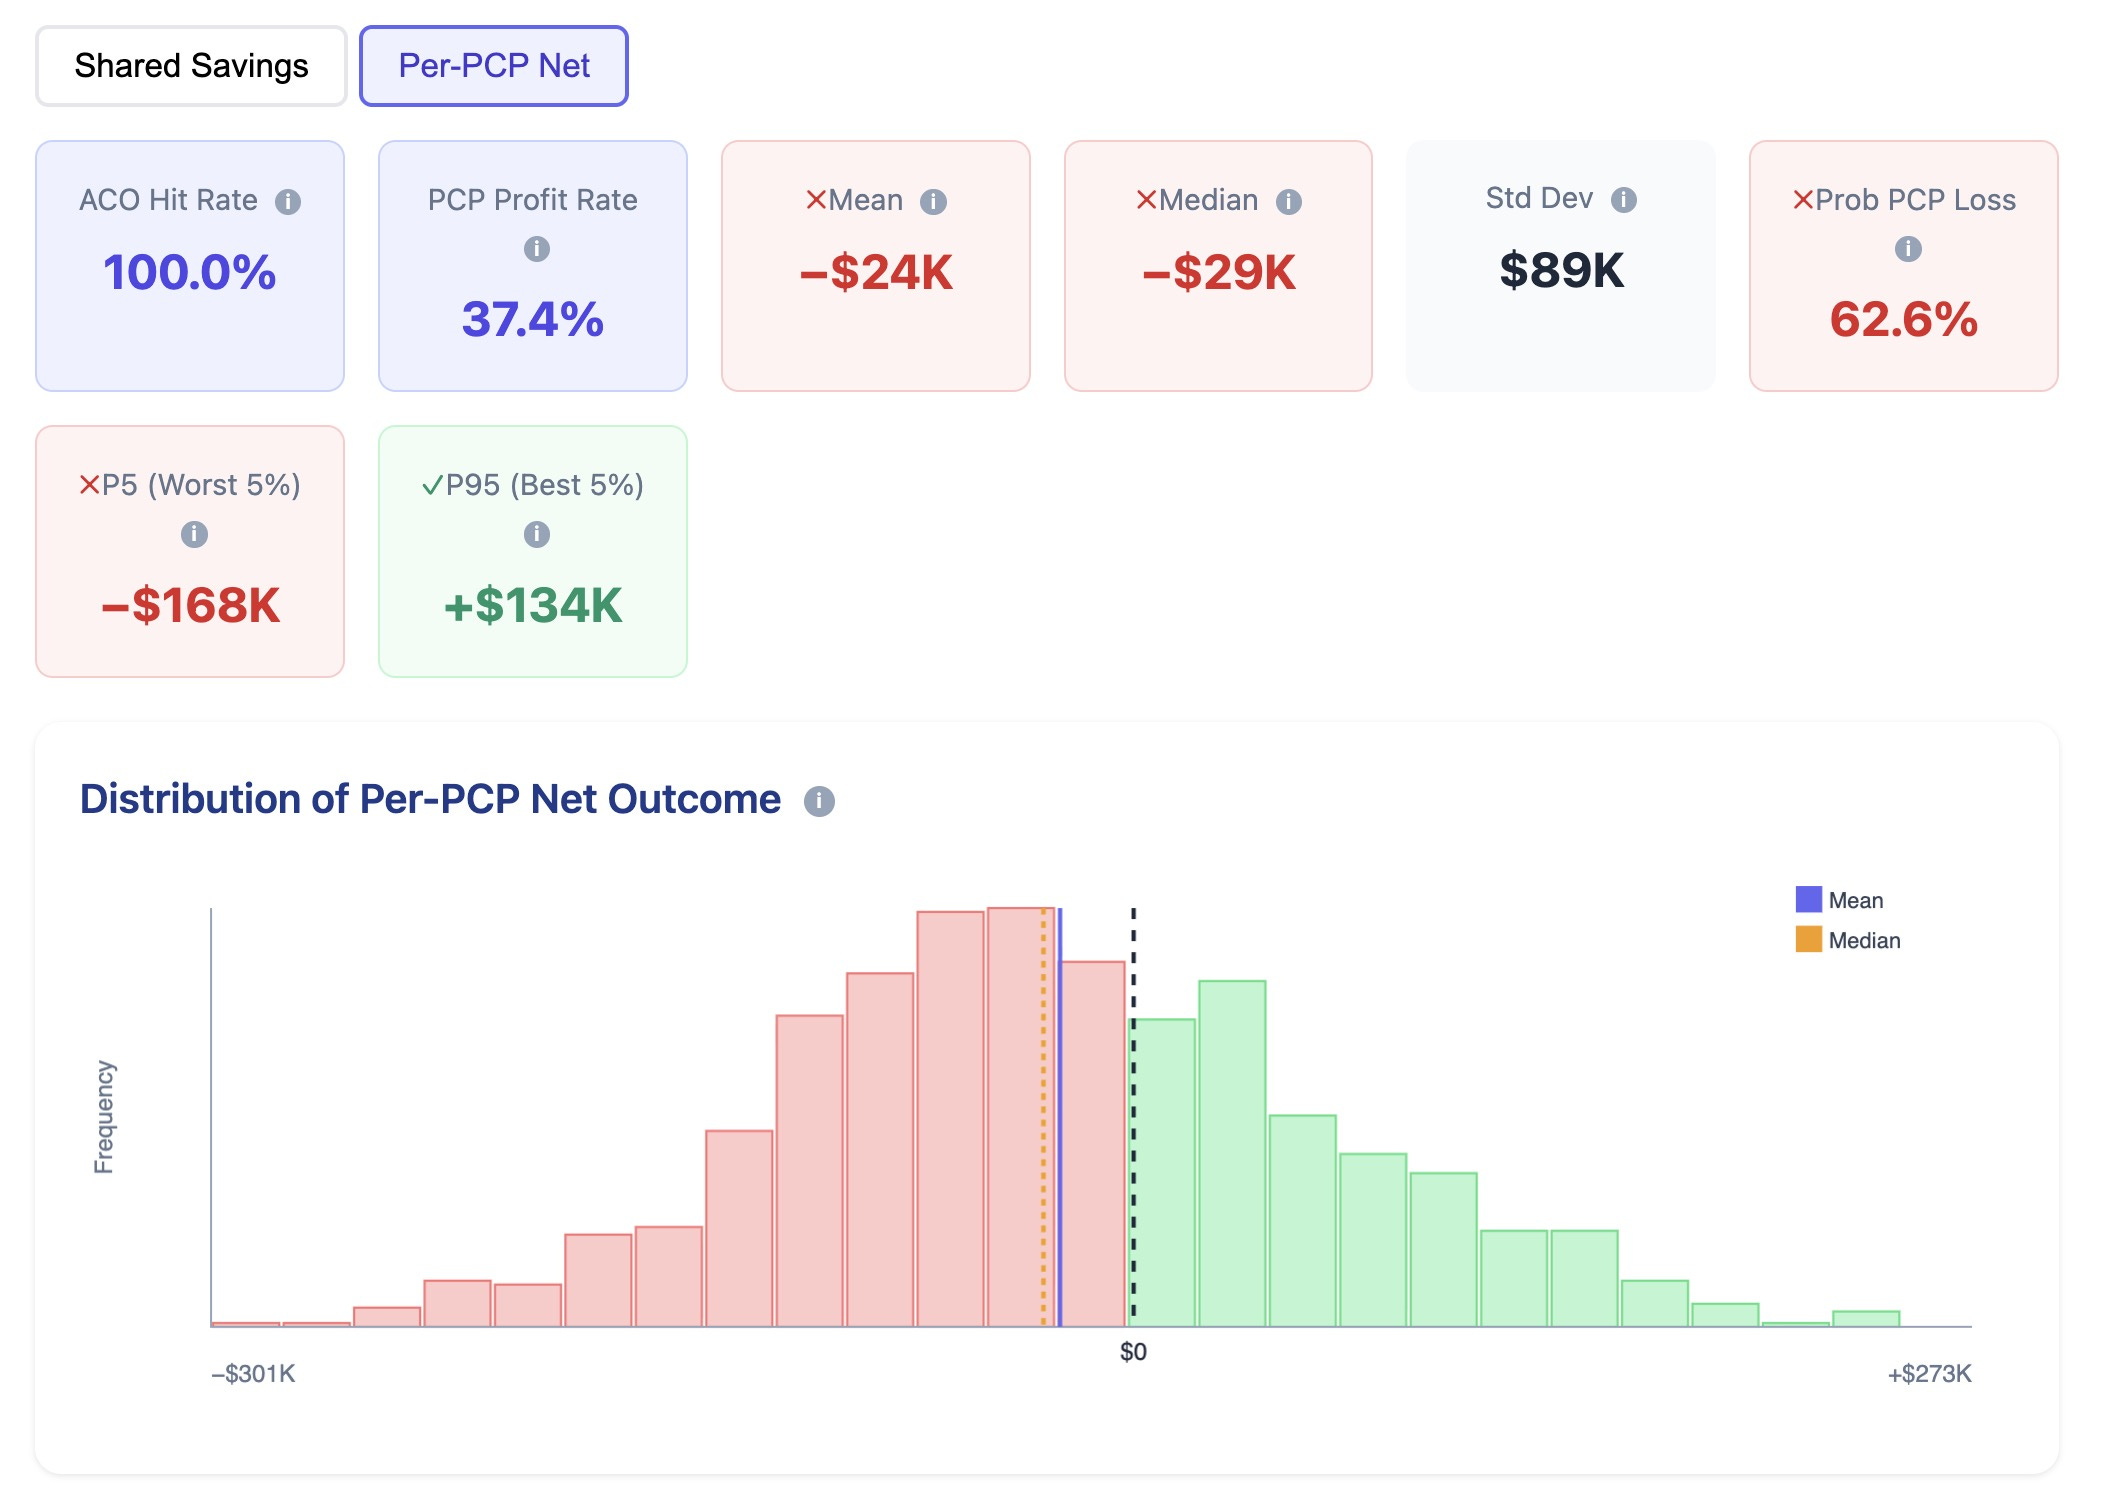
The distribution of shared savings for independent PCPs shows a 62.6% loss with an average loss of $24k.
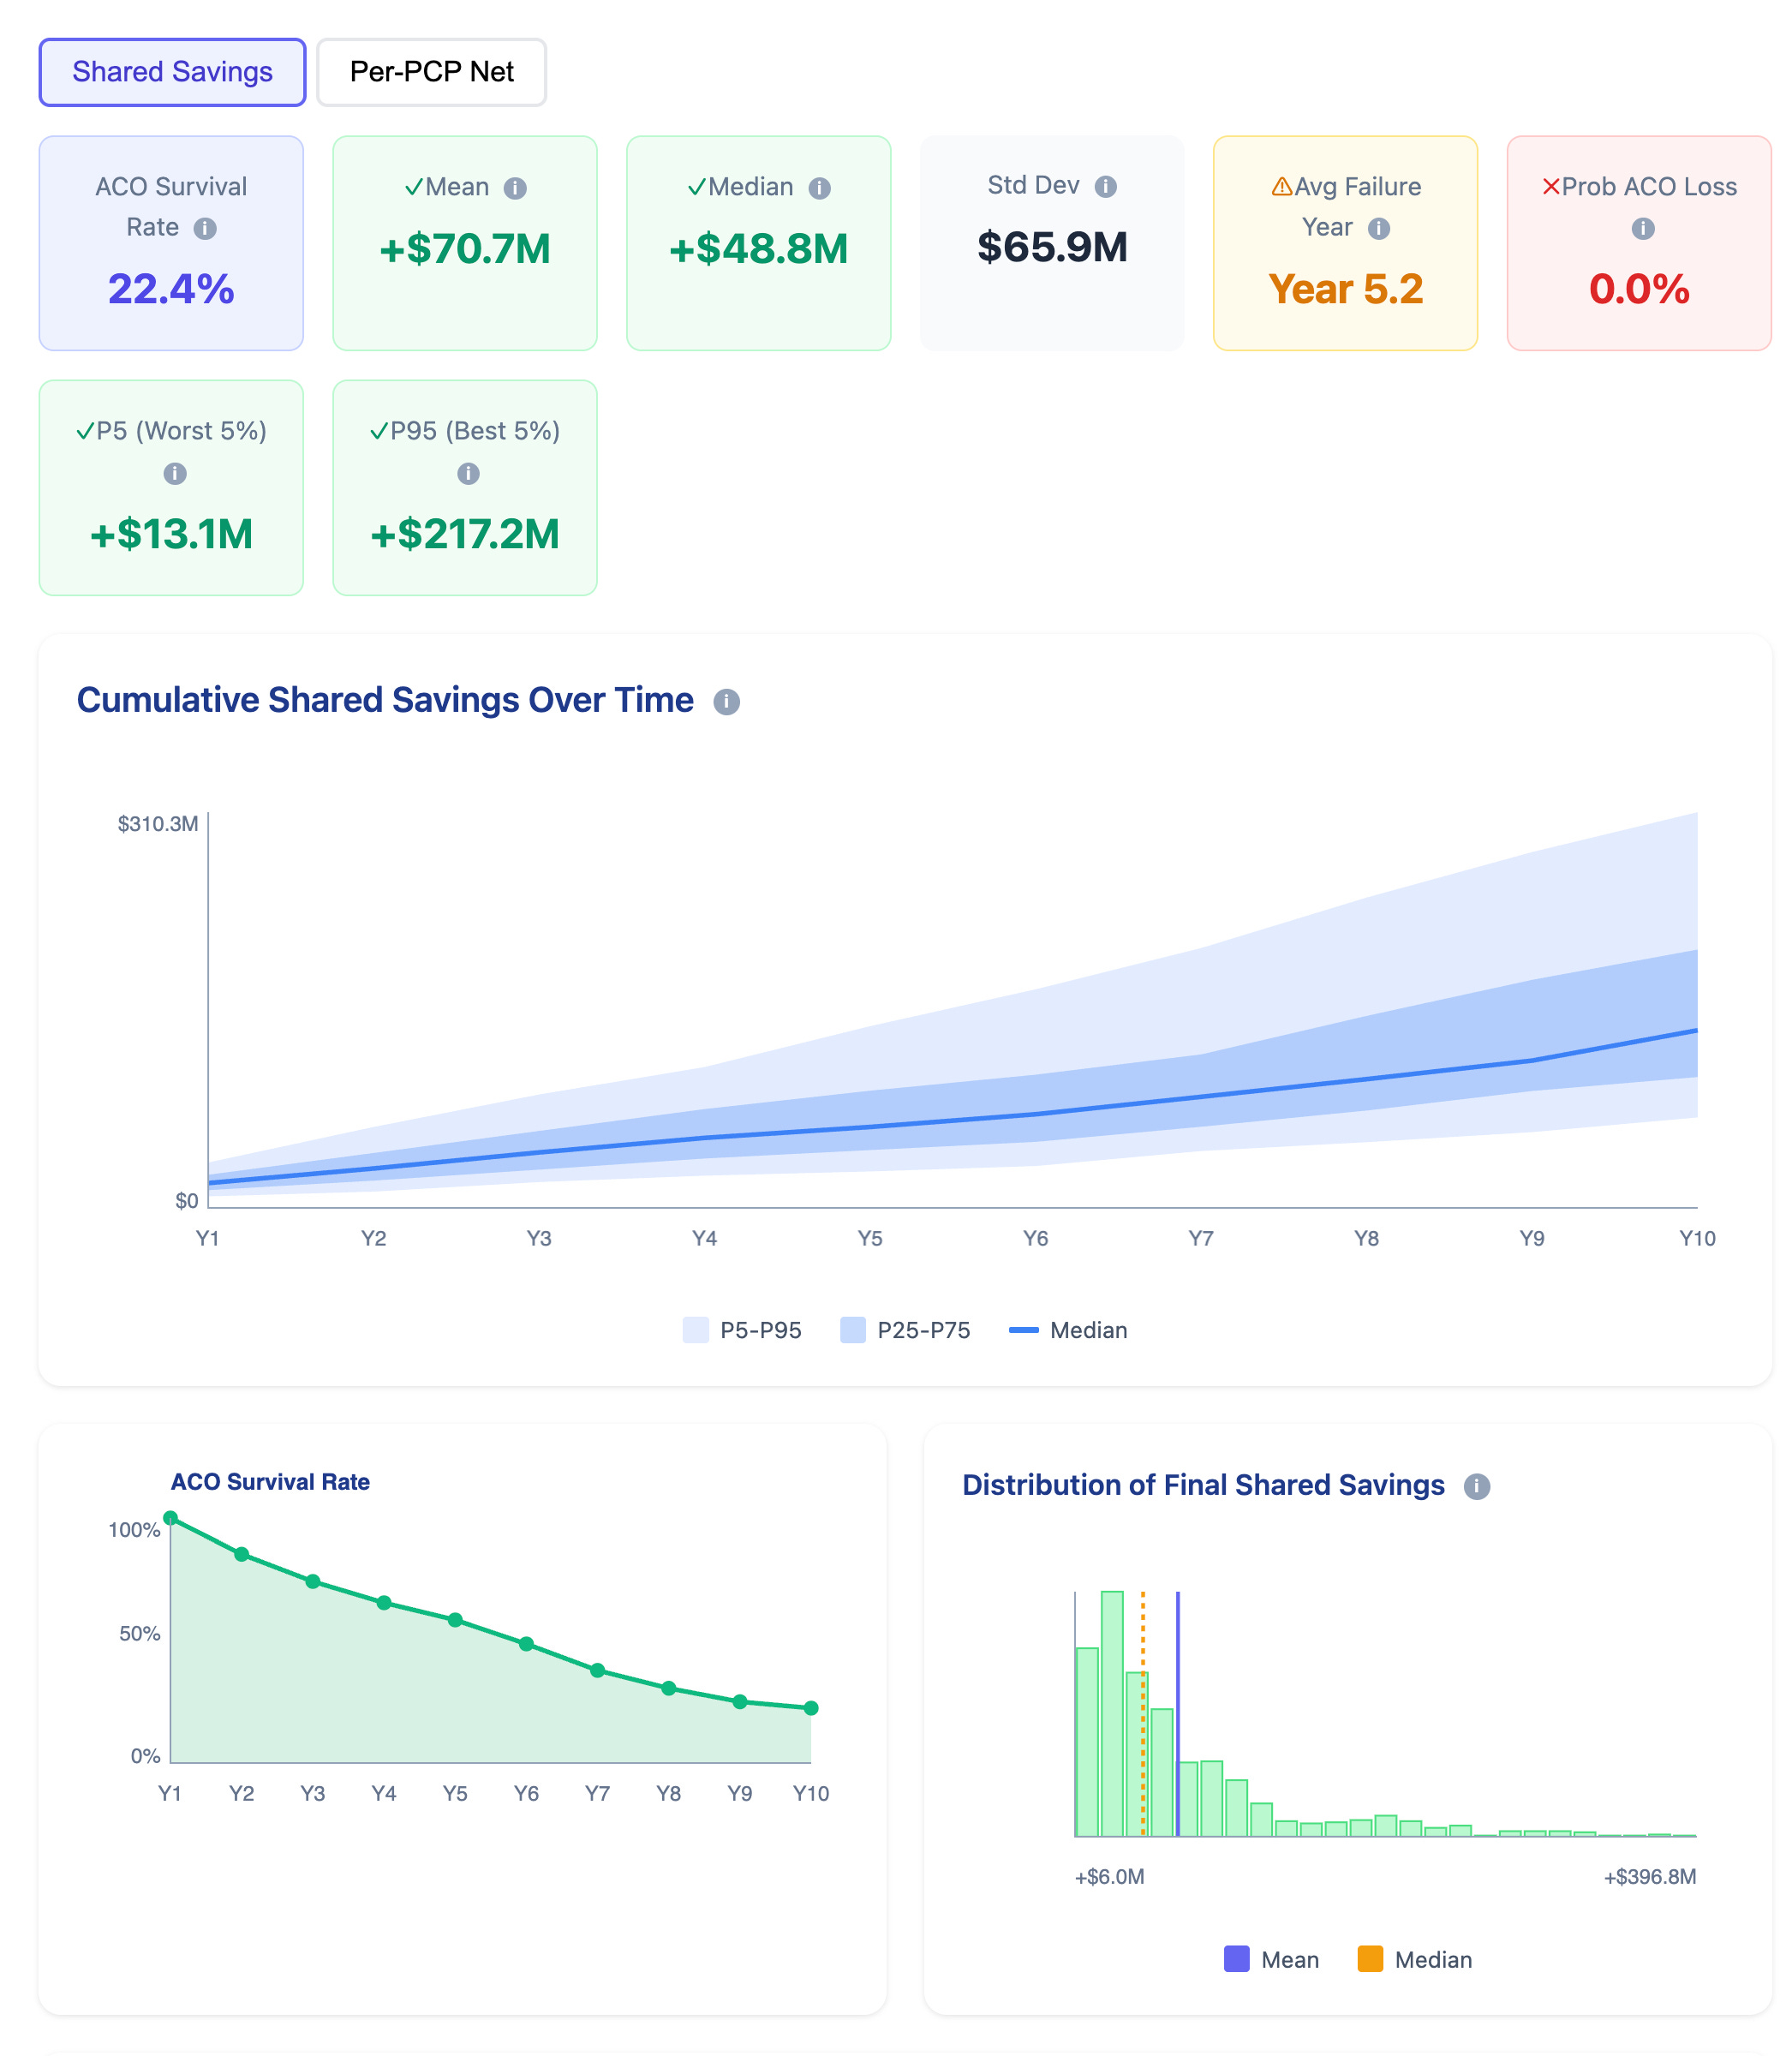
If we extend the Monte Carlo simulation to 10 years the results are even more dismal. ACO survival rate drops to 22.4%, and most of the shared savings are in the first few years of ACO operations.
Final Thoughts
Even when an insurance company genuinely wants to help PCPs reduce the total cost of care by investing millions of dollars, the value-based care model is not sustainable. The underlying financial structure still betrays PCPs, forcing them to either exit practicing medicine, or become employed by large health systems.
You can play with the model here.
Please leave comments and suggestions on how I can improve the model.